
What is Standard Deviation in Trading?
Standard Deviation is a statistical concept which measures how deviated individual values are from its mean value.
Standard Deviation in Trading can be studied as a range of 1st, 2nd and 3rd deviations from the mean value. These deviations form ranges viz 1st, 2nd and 3rd deviation range. As formulas for calculating these ranges are of less use, we would not go too deep into it.
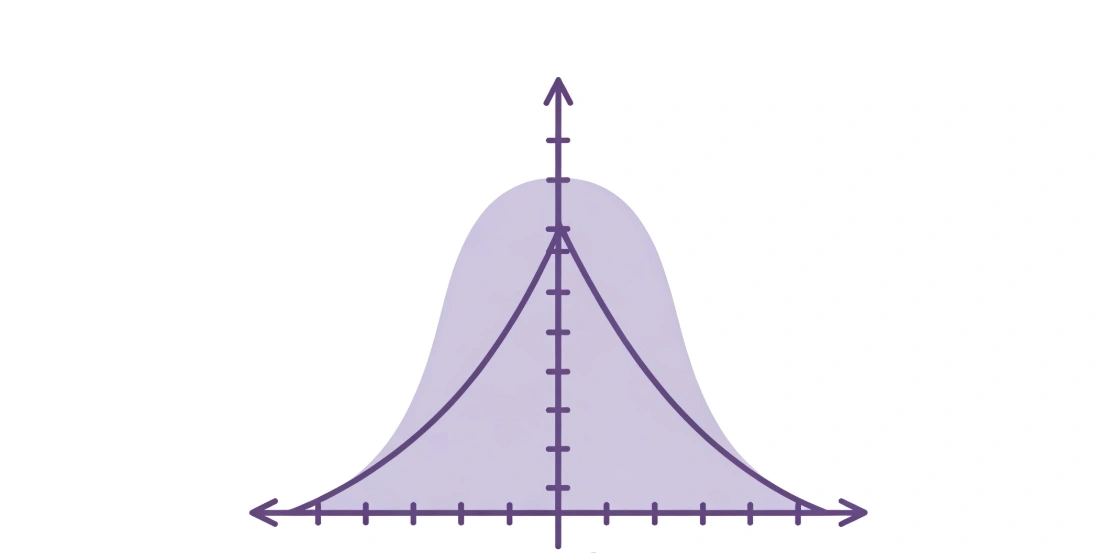
In ideal form (aka normal distribution of data), 68% of data is present within (+-)1st deviation from mean value and 95% within 2nd deviation. Rest 5% is beyond 2nd deviation.

In trading terms, 200 EMA is the average of the last 200 candles, in ideal form, price should stay in between 1st deviation 68% and 2nd deviation 95% of the time. As markets do not form exact normal distribution but we can still use the concept to increase probability of winning.

The above chart shows the range of 1st and 2nd deviation represented by green and red lines from mean value (200 SMA, black line). The indicator used to achieve this is Bollinger Bands.
Formula to calculate standard deviation –

An example as to how these ranges are calculated:
Mean = 100, value of Standard Deviation = 10
Range of 1st deviation – 100 + 1(10) = 110 and 100 – 1(10) = 90
Range of 2nd deviation – 100+2(10)=120 and 100-2(10) = 80

The central line is SMA 200, which is the avg of the last 200 candles. The upper and lower bands are set as 2 deviations from the central line (the same can be set as 1 or 3 as per requirement).
The above chart shows how price tends to stay within the 2nd deviation range from the average value of the last 200 candles. Price always has a tendency to come back to its mean value.
Generally, 200 SMA is used in bollinger bands as it works well for hourly and Daily TF. one can tweak and play around this number on different TFs to get the best moving average being respected by the stock/indices.
As per ideal situation (normal distribution), 95% of the time price should stay between these bands. Since markets do not follow the ideal situation, we can still bet on the probability that the market should stay within the channel.
Application of Standard Deviation in Trading
Just because the price touches the upper or lower band, it does not guarantee the reversal.

The above chart depicts how the price keeps moving up along with the upper line and does not reverse immediately. But the price does halt near the upper line and it doesn’t go up ferociously. These deviations, like RSI, represent overbought and oversold zones.
Now, this information can be used in following ways:
- Avoid going long near the upper line and going short near the lower line and one should look for booking partial profits.
- Selling calls when price reaches the upper line. This is easy money. Same is true in case when price reaches the lower band, one can look for selling puts. Puts should not be sold if there is a crash or the market is reacting to the news because fear spreads faster and there is no end to it. Every study fails when the market is falling due to fear.

This is what happens to deviations when there is fear in the market, so do not take reversal trade blindly specially when the market is falling.
RSI and Deviations
Concept of deviations should be combined with other concepts and confirmations to increase the probability.

The above chart represents the 2nd deviation range. It is to be noted that just because price is touching 2nd deviation, positions should not be created. We can see clearly, price keeps falling with slight pullbacks.
Let’s try to combine deviation with RSI divergences and Support Resistances:

The chart again shows the 2nd deviation range. As the price touches 2nd deviation, we can see the price making bearish divergence on RSI. Further, we can increase our conviction after price breaks immediate support.
These multiple confirmations give us more confidence to take the trade. Again, this is not a full proof method but it works better than just using deviations. Also, one can use different studies to complement the above studies and make own strategies.
Key Takeaways
- Trading is a game of probability. One must include mathematics to increase the chances of winning.
- Standard deviation is a concept of statistics which tells us about 95% of data points are located between 2nd deviation.
- Prices are always pulled back to its moving averages.
- When price reaches the 2nd band of deviation, the probability of it going even further is less.
- Study of standard deviation in trading should be complemented with other ideas like RSI divergences and Support Resistance zones.