What is Relative Strength Index (RSI)?
Relative Strength Index (RSI) is a momentum indicator which measures the strength or rate of increase/decrease in prices. Value of RSI increases/decreases when there is a large increase/decrease in prices in relatively less time. Relative Strength Index has a value between 0 to 100.
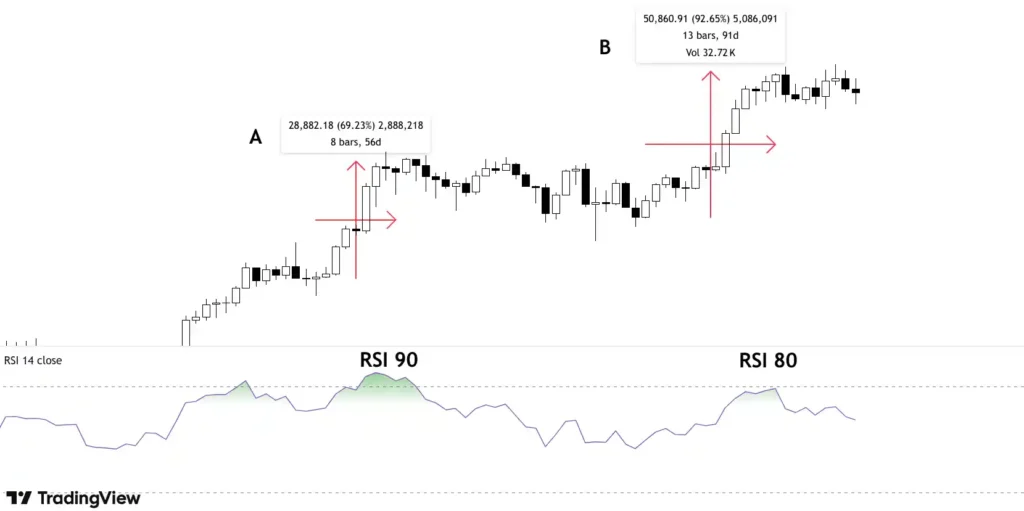
At point A, RSI is 90 and at point B, it is 80 but the increase in price at point B (90% approx) is more than A (70% approx). This is due to the fact that the rate of change in price at point A is more as the increase in price is only in 8 candles as compared to 13 candles at point B.
Formula for calculating RSI = 100 – [100/(1+ avg gain/avg loss)]
Average gain/loss is generally calculated as the average last 14 candles.
Strength Indicator
A very basic inference of Relative Strength Index is if it is above 50, it could be interpreted as a bullish signal since avg gain is more than the avg loss indicating continuation of existing uptrend.
Additional Inferences
- RSI > 50 to 70 – Mild to strong bullish momentum
- RSI > 70 – Overbought zone (potential reversal or pullback)
- RSI < 50 – Indicates sellers gaining control (bearish sentiment)
- RSI < 30 – Oversold zone (potential reversal or bounce
Reversal Indicator
Overbought zone: Relative Strength Index above 70 means prices have risen too much in a short span of time. This momentum is unsustainable and prices tend to take a pause or reverse.
The opposite is true for the oversold zone which is when the RSI is below 30.
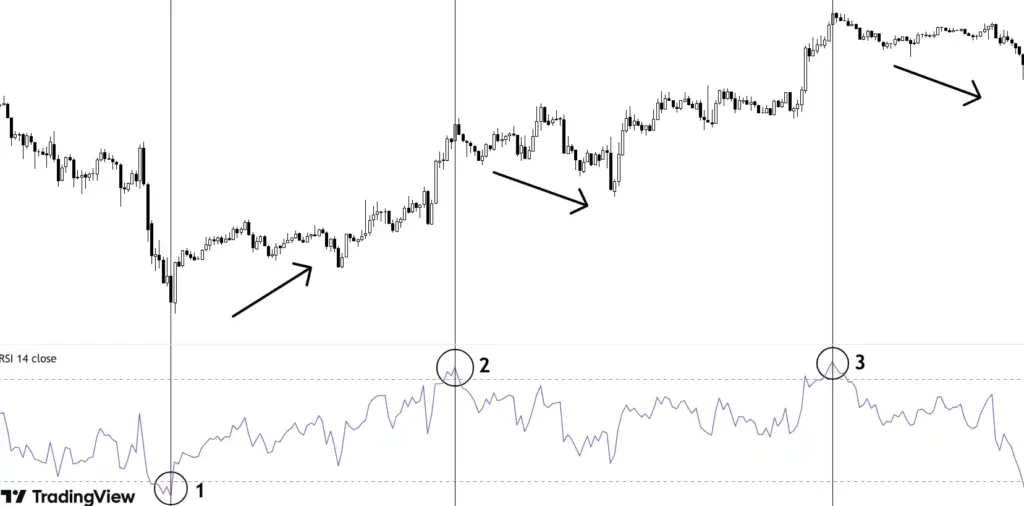
At point 1, RSI is oversold and the same is overbought at point 2 and 3. The price reversed and started going up after the oversold zone and it started to go down after the overbought zone.
It is important to combine this study of RSI with other concepts like Support Resistances, Volume, Trend etc.
Divergences
This study of Relative Strength Index is probably the most important and effective one. This studies the divergence in RSI and price, that is their movement in opposite direction.
- Bullish Divergences
- Strong bullish divergence
While the price is making lower low, RSI makes higher low. This technically means the rate of fall is decreasing and bears are losing their control.
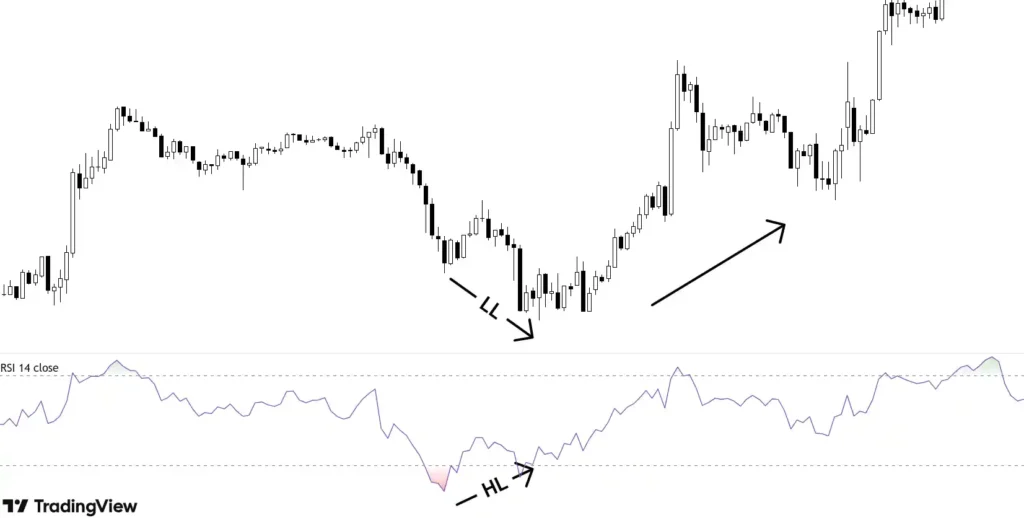
One can also see the price was oversold and reversal was on cards. The divergence formed gives extra confirmation to it.
- Medium bullish divergence
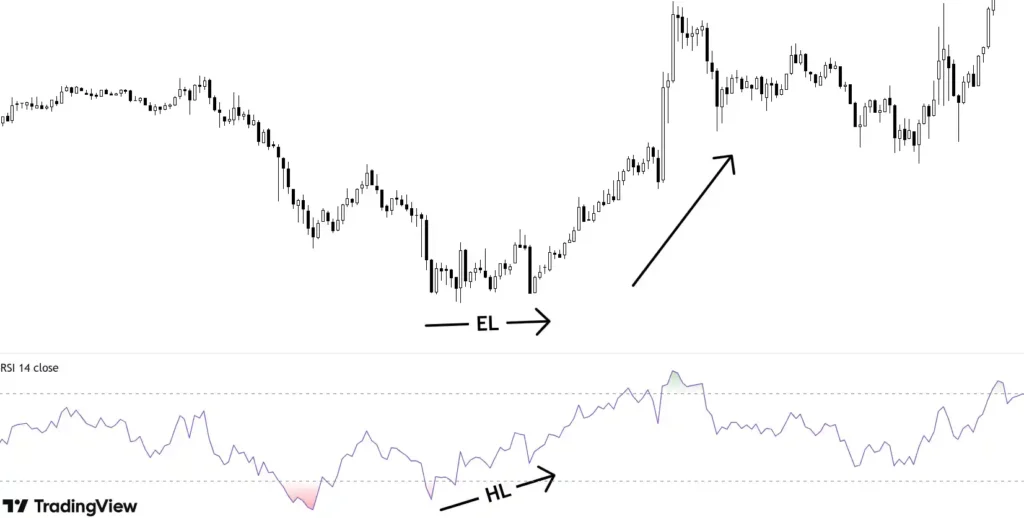
In this, price is making equal low and RSI makes higher low.
- Weak bullish divergence
The price is making lower low but RSI makes equal low.
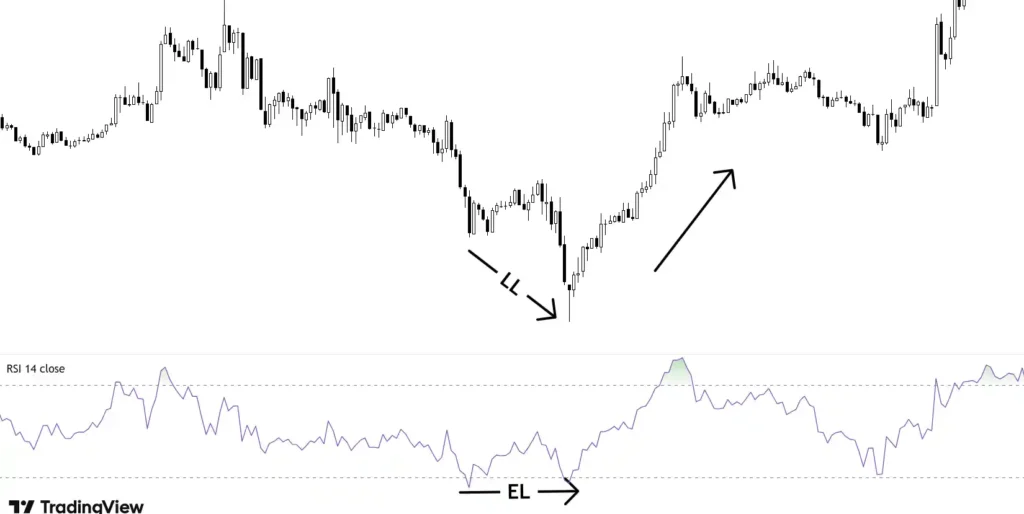
- Hidden bullish divergence
When price makes higher lows and RSI makes lower lows, this is known as Hidden Bullish Divergence.
It indicates that while momentum is decreasing, the price remains strong and continues to form higher lows. This suggests that the market is taking a break in the uptrend and consolidating before a possible continuation.
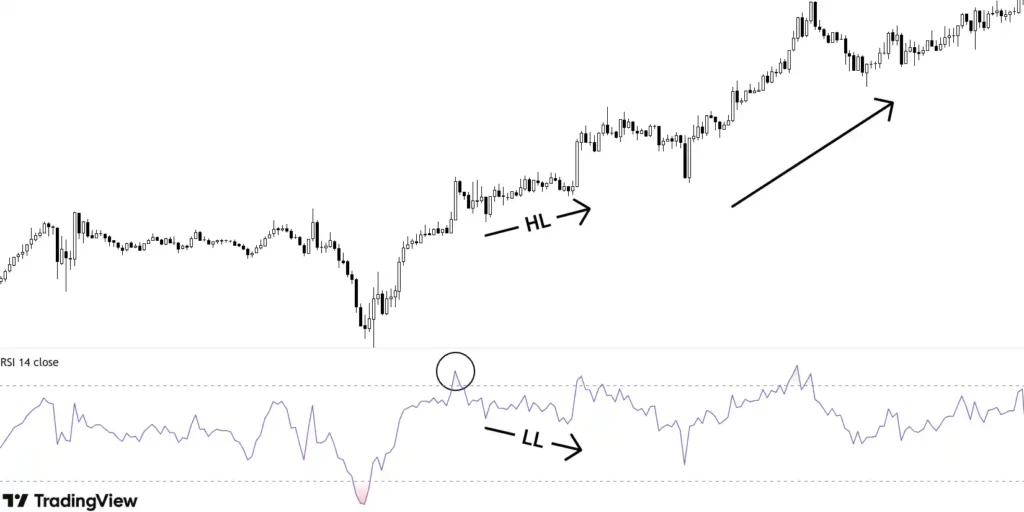
Additionally, it allows RSI to cool down, especially if it was previously in the overbought zone.
- Bearish divergence: All four cases of bullish divergence also apply to bearish divergence but with an inverse setup, as depicted below.
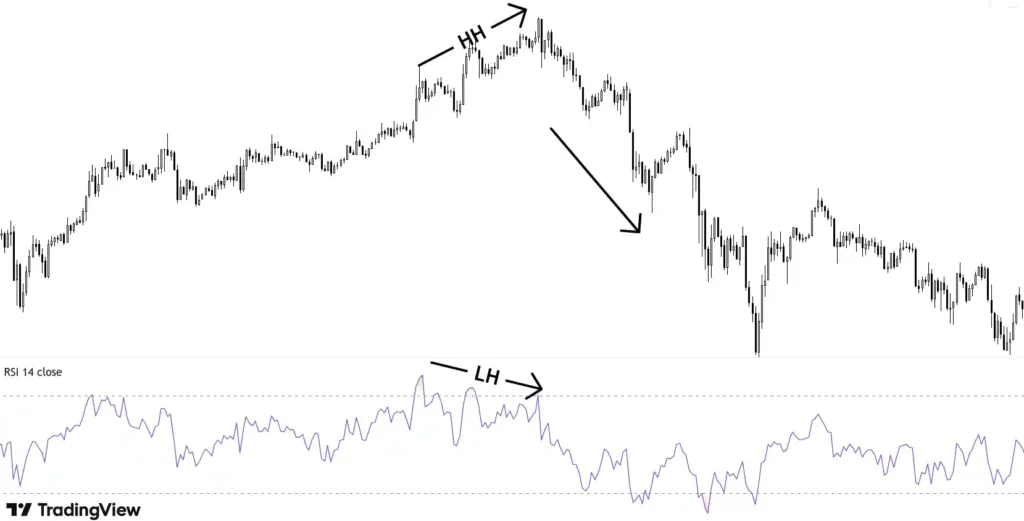
- Strong bearish divergence
Price is making higher highs but RSI makes lower highs. This means the rate of increase of price is going down and bulls are losing their ground.
- Medium bearish divergence
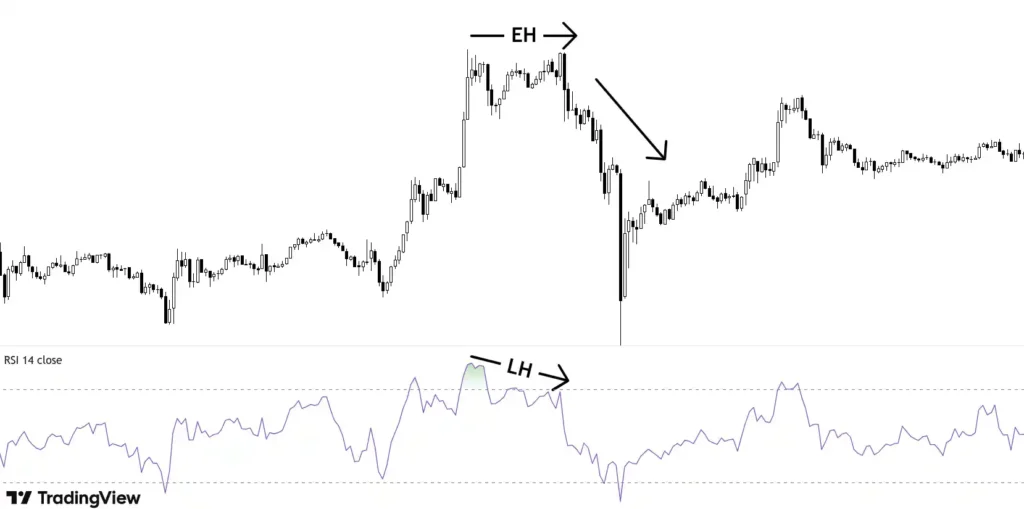
Price making equal high while RSI making lower high.
- Weak bearish divergence
Price making higher high and RSI making equal high.
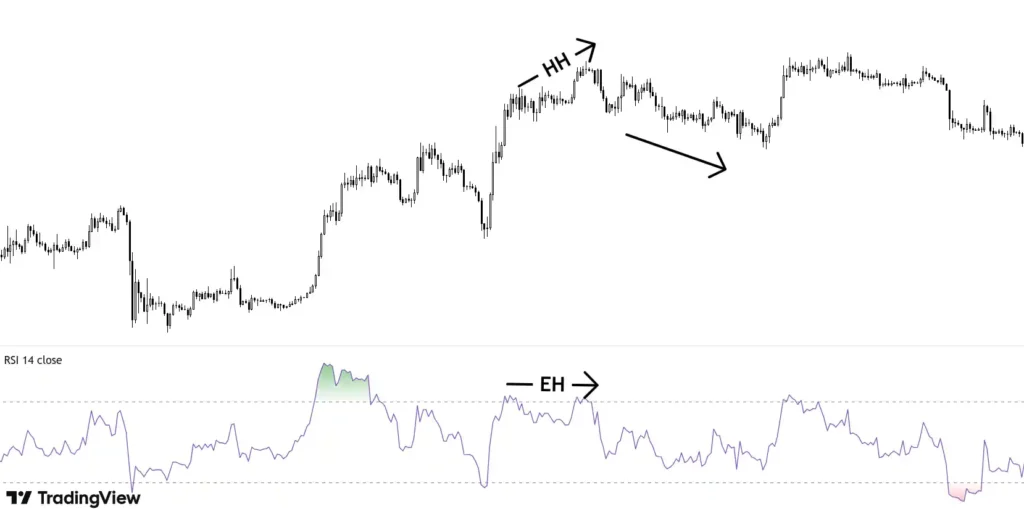
- Hidden bearish divergence
In this, price makes lower highs and RSI makes higher highs. Although the rate of falling is decreasing but price is not showing any considerable strength and keeps on making lower highs.
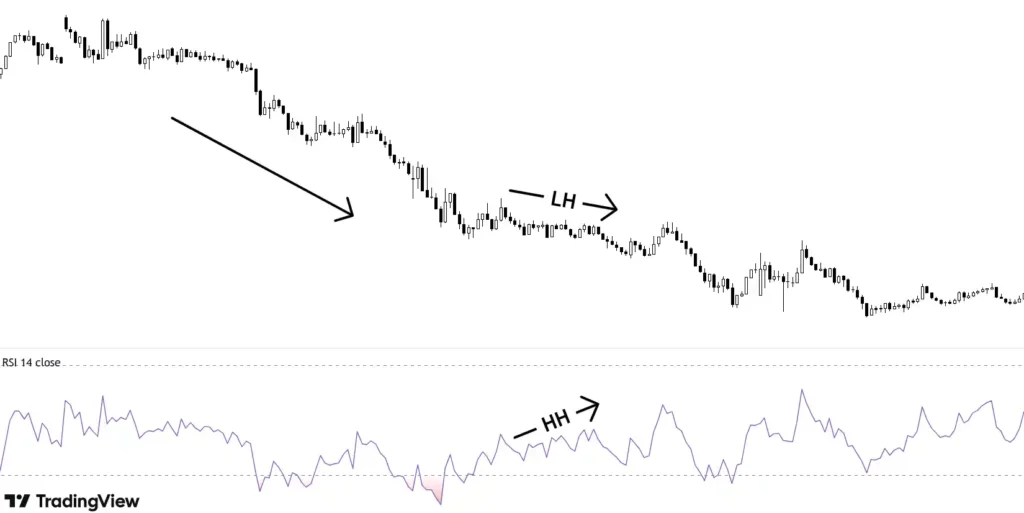
This also takes RSI out of the oversold zone and signals possible continuation of downtrend.
General Rule for Candle Difference:
- Typically, the two price points (highs or lows) used for divergence should be at least 5 to 20 candles apart to ensure a meaningful trend shift.
- Too few candles (e.g., 2-3) may lead to false signals as short-term price fluctuations can create misleading divergences.
- Too many candles (e.g., 20-30+) may indicate that the divergence is too stretched and might lose relevance.
Key Takeaways
- Relative Strength Index measures the rate of change of price that is how fast the price increases/decreases.
- Relative Strength Index ranges from 0 to 100. Above 70, it reflects overbought conditions and below 30, oversold.
- Divergence in price and RSI is a reliable indicator.
- Bullish divergence is when price makes lower lows and RSI makes higher lows.
- Bearish divergence is when price makes higher highs and RSI makes lower highs.


