Taking Your First Trade
This post summarizes all the key topics and explains how to identify a confluence of factors to confidently take your first trade. It’s important to understand that multiple confluences aren’t always available, but the more reasons aligning, the stronger your first trade becomes.
Timeframe and Trend
Always zoom out the chart to see the big picture. We are considering Daily TF as our primary in this example, so we will go to one TF up, Weekly. All the analysis will be done on primary TF.
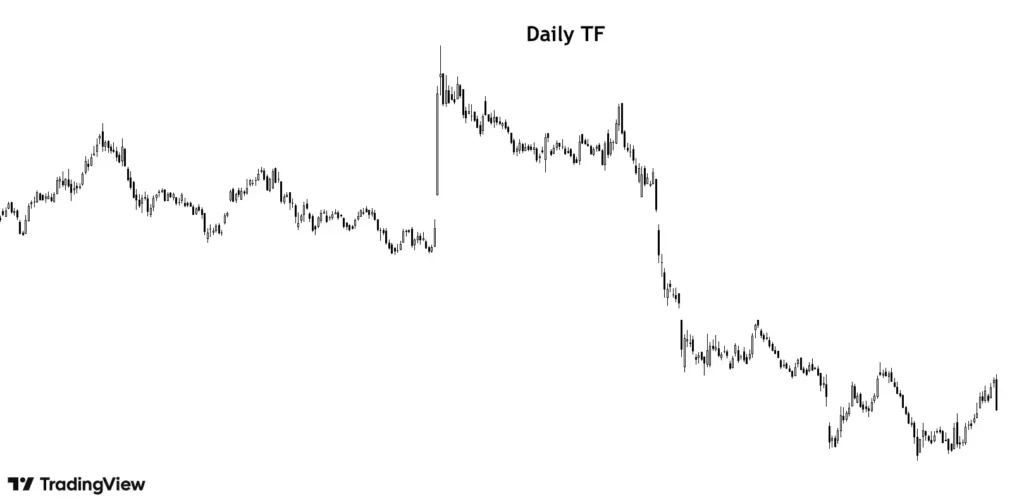
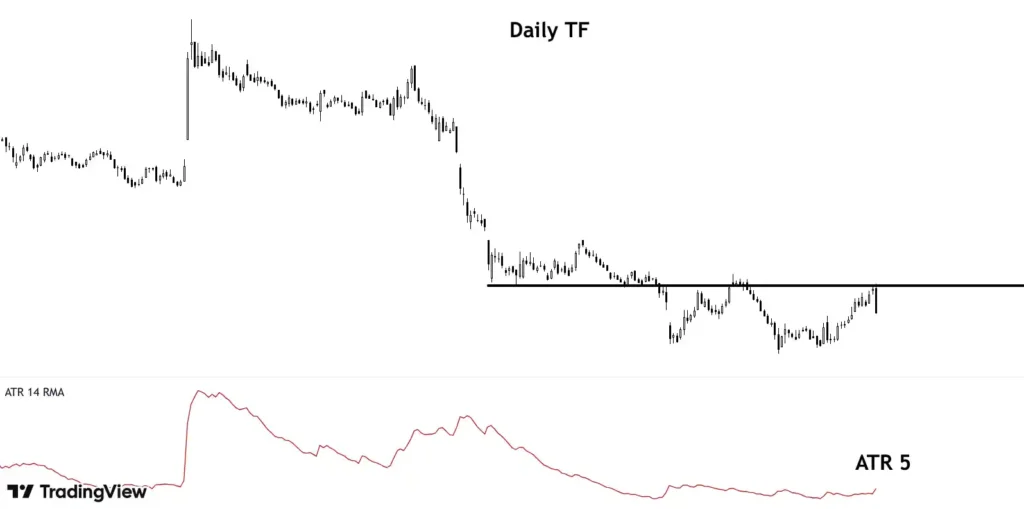
The above Daily TF does not tell much, that is the reason we need to switch to a bigger TF.
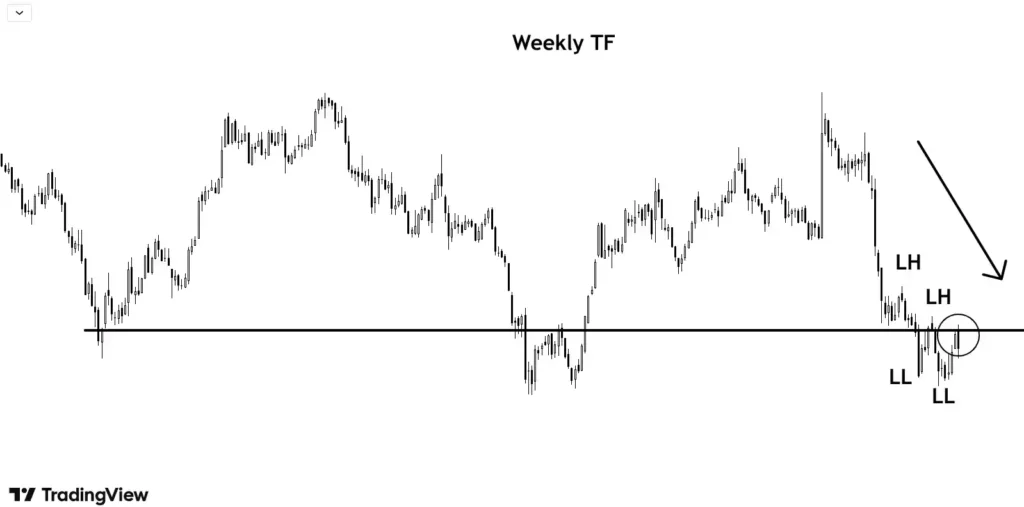
After switching to Weekly TF, we can easily identify current downtrend with price making lower highs and lower lows.
Support/Resistance, Candlestick Pattern and Volume
Also, a support zone can be identified which has been recently broken by the price, which now has the potential to work as resistance if the downtrend is to be continued.
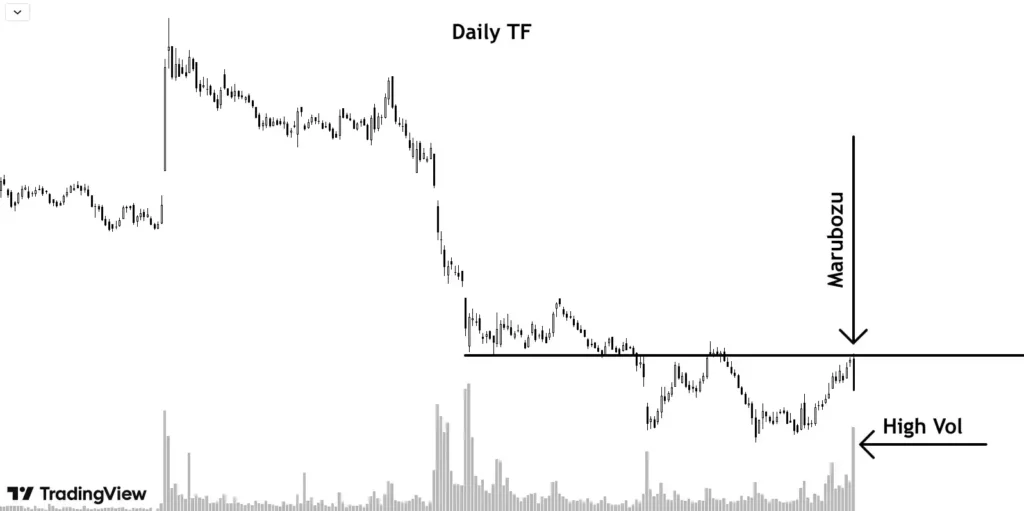
After identifying Trend of larger TF, we must only look to trade in the direction of prevailing market momentum.
After establishing trend and resistance, we come back to our primary TF, Daily.
We can see, price has taken resistance multiple times from resistance.
Recently, a close to marubozu candle with high volume (more than the average) has been formed which further adds to our bearish view.
Relative Strength Index
Adding RSI indicator to our charts, we can observe a hidden bearish divergence, on weekly tf, wherein price makes lower highs and RSI makes higher highs.
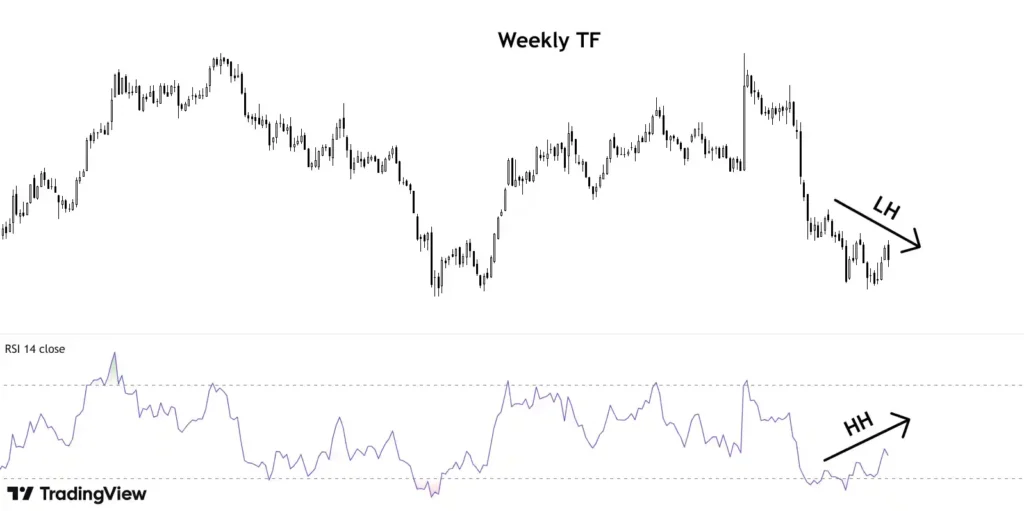
Now, we have multiple reasons to be bearish. Practically speaking, it’s rare to find multiple confluence but the more the better.
We are ready to take a trade but only after we have managed our risk deciding our position sizing and stoploss.
Average True Range (ATR)
ATR is around 5.00. Considering SL to be at least 3 x ATR, we are going to keep our SL with a buffer of minimum $15.00.
Risk Management
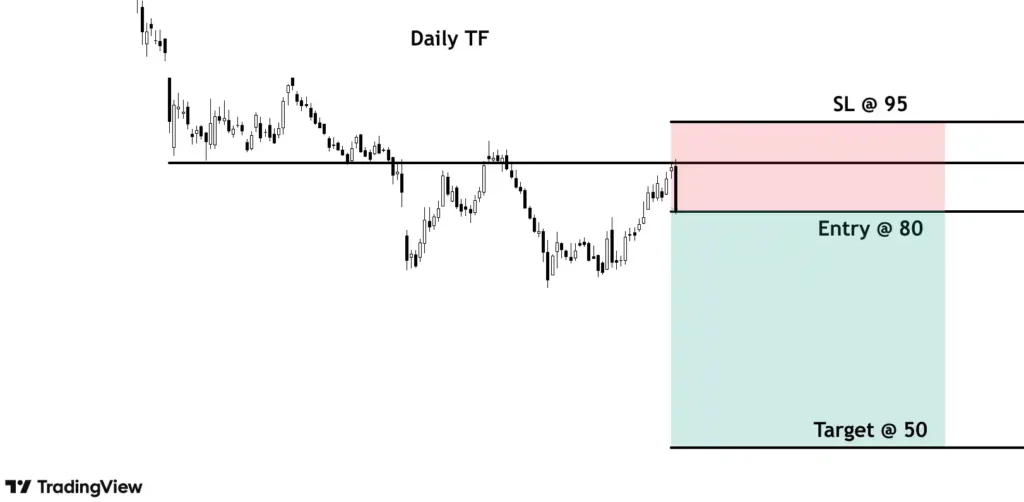
Entry point is at $80
SL is at $95 that is $15 risk per unit.
Note, SL is to be kept above resistance level so that we exit only if resistance level is broken.
Keeping Risk Reward ratio at least 1:2, target is at $50.
Say the total capital is $15000 and risk to be taken per trade is 1% that is $150.
No of units to be bought = 150/15 = 10
After entering, either take profit or accept losses gracefully and keep your emotions in control.
Always remember, you are only making educated guesses with all this analysis and this is a game of probability with no guarantee of winning every time.
But if you respect and believe in mathematics, always manage your risk and know how much you are willing to lose and are comfortable with before entering a trade, profits will follow.
Key Takeaways
- Zoom out the chart and find trends and support/resistance zones.
- Analyze volume and candlestick.
- Use your preferred indicator to further confirmations.
- Manage your risk and know how much you are willing to lose before entering a trade.
- Remember, your first trade is not about being right; it’s about following a structured process backed by confluence, risk management, and discipline.


![5-Minute Guide to Becoming 50% Pro Trader [Beginner]](https://thsinvestor.com/wp-content/uploads/2025/02/pro-trader-768x384.webp)
