In technical analysis, trading patterns help traders anticipate future price movements based on historical chart behavior. In continuation to the previous chapter, here we will be covering neutral and reversal trading patterns, each serving a unique purpose in market prediction.
Trading Patterns – Neutral
Existing trends are of less importance in such patterns as they can either go with the existing trend or against it.
Rectangle Pattern
This pattern is simply price oscillating between Support and Resistance with reduced volume activity as shown in the chart below.
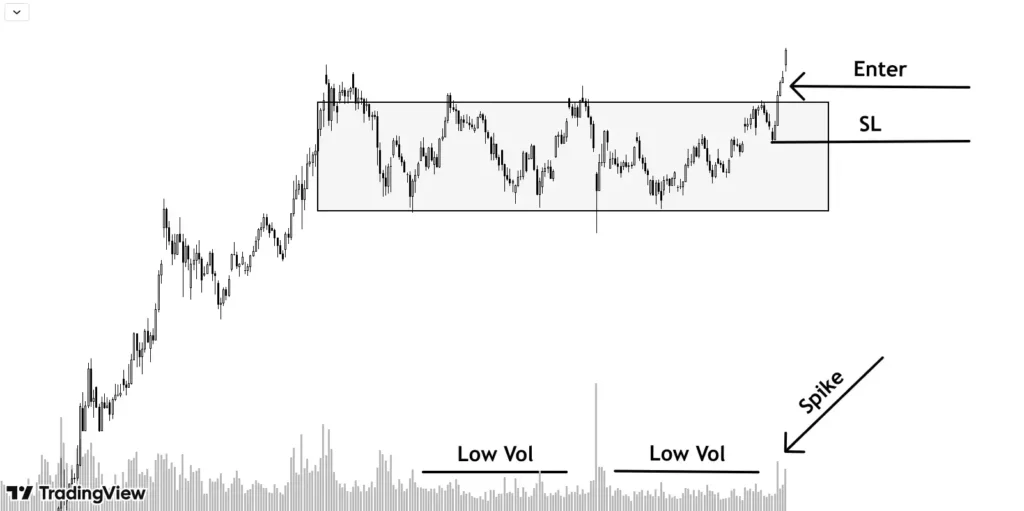
Such patterns may or may not lead to trend continuation and can give breakout either side. Whichever zone, Resistance or Support, is being tested more by the price, becomes weak and susceptible to be broken. In other words, if price is spending more time near support, chances of breaking the support zone are more.
Consolidation in such patterns can be prolonged wherein both buyers and sellers are not decisive. Such rectangles are also formed at the top or bottom of a trend representing distribution or accumulation zones.
Falling Wedge
A wedge is formed by two converging lines and in a falling wedge, both these converging lines are down slopped. A falling wedge gives breakout upside and can appear in both uptrend or downtrend.
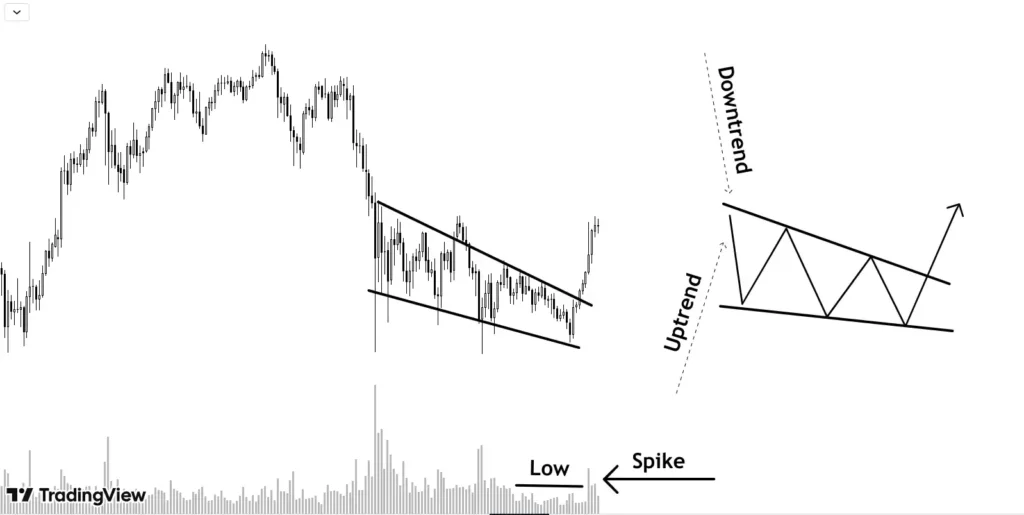
In a falling wedge, price is making lower highs and lower lows but every subsequent selling swing is reducing, represented by convergence of wedge, which shows selling pressure is reducing.
The volume activity also reduces in later stages of wedge which depicts accumulation by smart money.
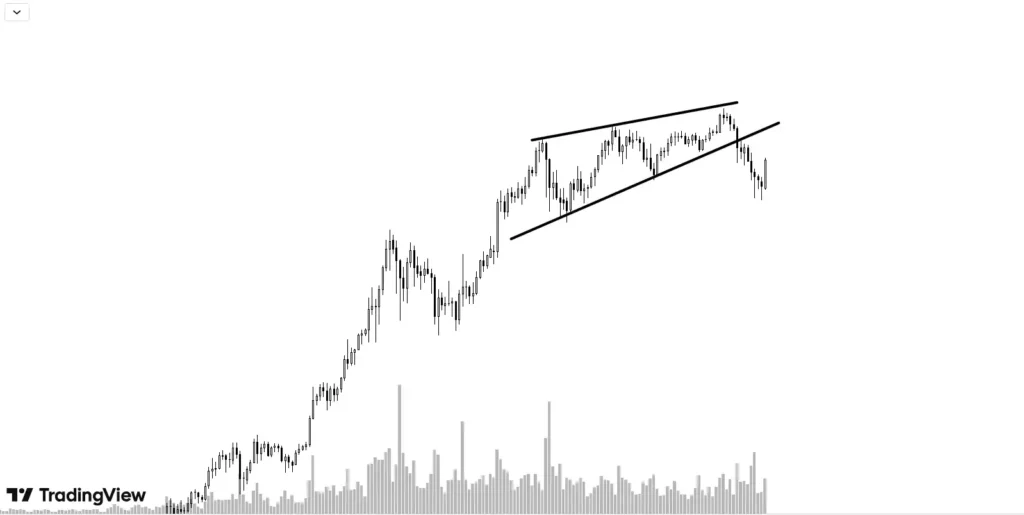
Rising wedge is a bearish pattern which gives a break down.
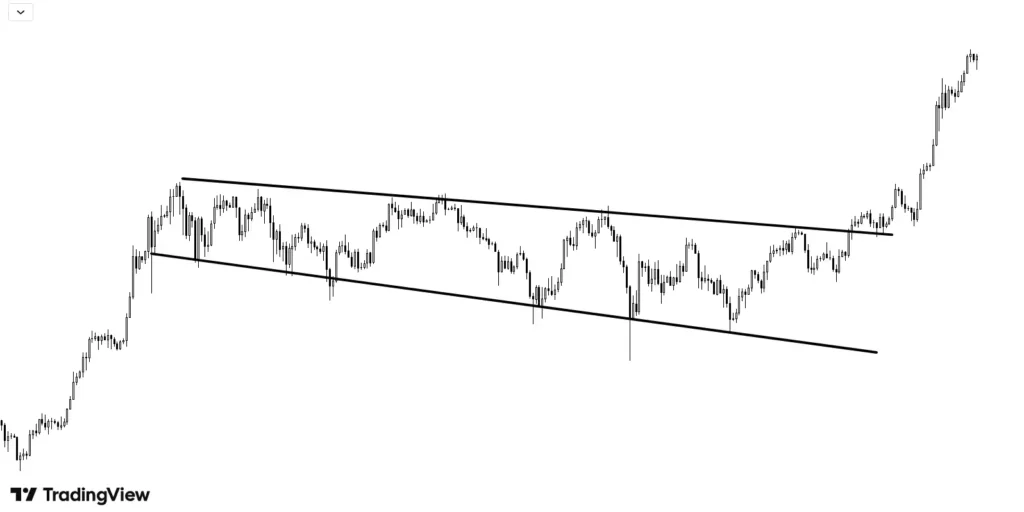
Sometimes, wedges can be broadening which pretty much work the same way. The only difference is the two lines are diverging away from each other rather than converging.
Trading Patterns – Reversal
They mark the top of existing trend and indicate a reversal. The two most reliable Reversal trading patterns are discussed below:
Double Top
A double top is a M shaped pattern when price rises to a top and retraces a bit and forms another top near the same level of last top where sellers overcome buyers and price end up breaking the neckline (previous low).
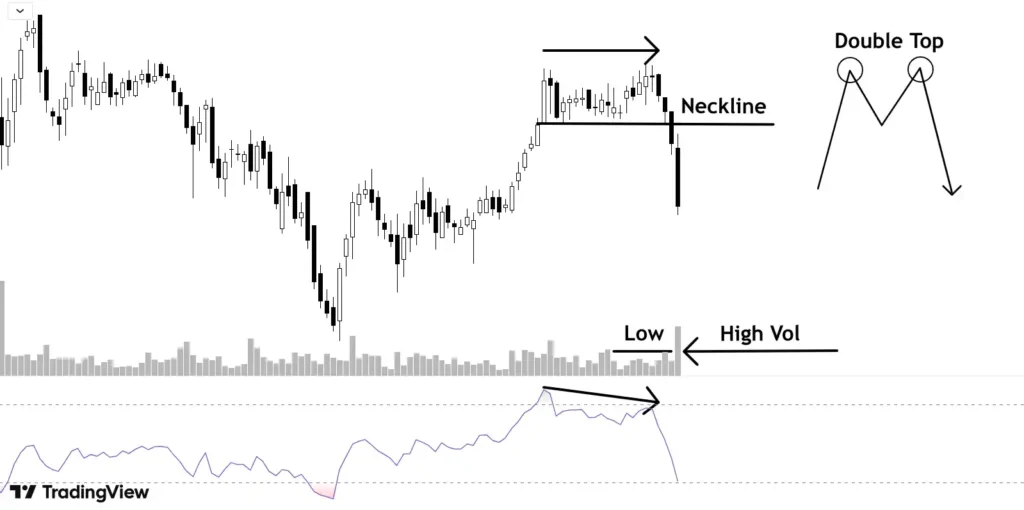
The pattern is easy to spot and reliability of the same can be increased by keeping the following points in mind:
- RSI in overbought zone.
- A divergence between price and RSI.
- Suppressed volume activity during 2nd leg up.
- Breakout with volume and Retest of neckline.
- The two tops should not be too close in time and broader time gap increases reliability.
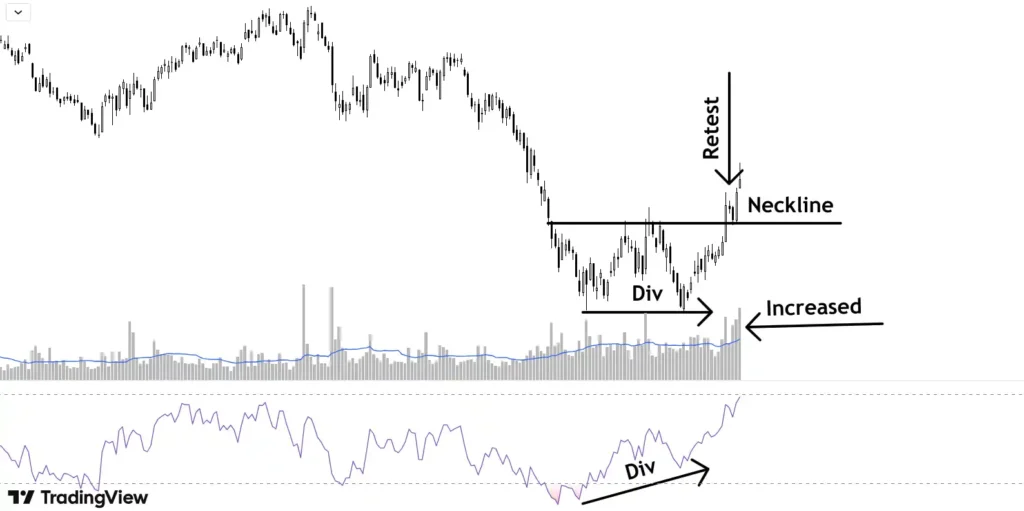
Double bottom is opposite side of double top with all the conditions reversed.
Triple Top
It is an extension of double top wherein price makes one more attempt to break the double top made in recent time. This pattern is more reliable than double top as buyers failed to break a high 3 times which shows the sellers are aggressive at the top.
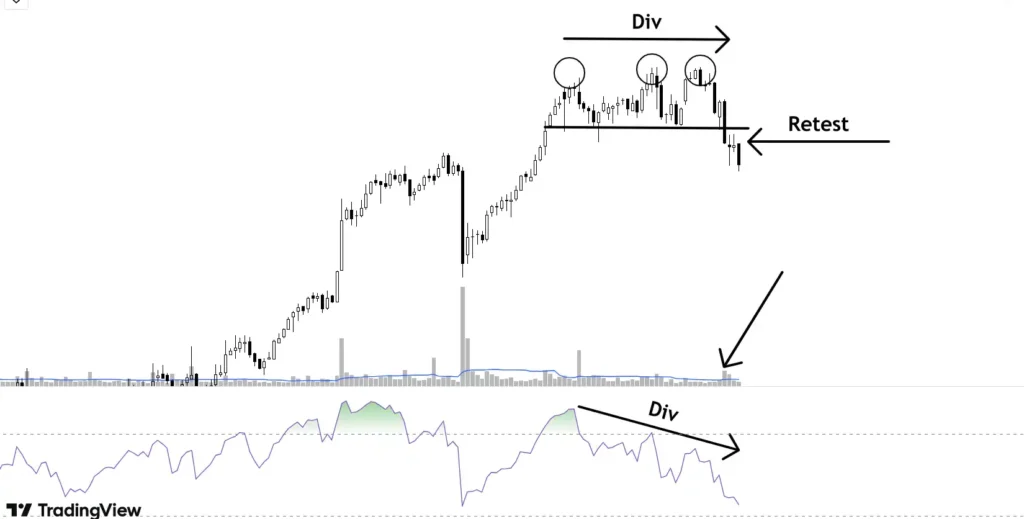
Volume declines with every try of buyers to break the top and price breaks the neckline with comparatively higher volume. Entry should be when price is retesting the broken neckline.
Other conditions mentioned in double should be applied to improve the reliability of the pattern for instance RSI being in overbought zone and divergence being observed.
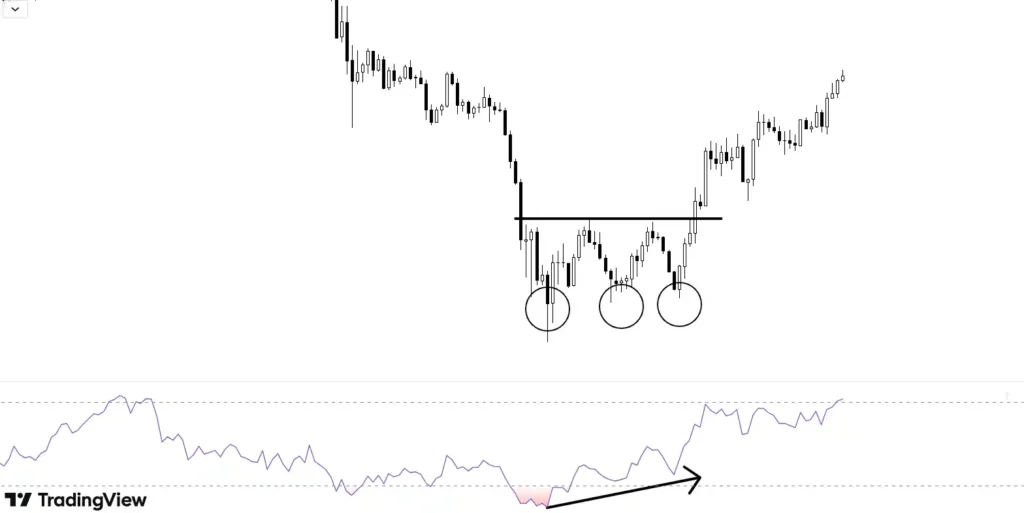
Triple bottom is formed when price after downtrend is unable to break double bottom and buying pressure increases which drive the price up against the previous trend. Traders should look for a confluence of other confirmations before entering a trade.
Key takeaways
- Neutral trading patterns are indifferent to existing trends.
- Rectangles and wedges are examples of neutral patterns.
- Reversal trading patterns mark the top of existing trends and indicate potential reversal.
- Double top/bottom and Triple top/bottom are examples of reversal patterns.
- Traders should study different indicators during different phases of these chart indicators to improve the reliability of patterns.
