

Bitcoin Analysis for Next Week starts with a simple message: buyers are still in control. Bitcoin closed the week at $86,480.30, up 2.40%, and stayed above the key $82,000 level.
Price is moving sideways between $82,000 and $87,000 while volume has dried up considerably. This looks more like a pause after a breakout than a sign of weakness.
Our market view remains bullish as long as Bitcoin continues to hold above $82,000. ETF buying, MicroStrategy and fresh stablecoin liquidity absorbed the selling even as the Fed and the dollar turned hawkish.
Key Takeaways:
1. ETFs added $241.1M this week, so institutions kept buying dips instead of selling them.
2. Stablecoin supply grew by over $1.2B which shows fresh cash is waiting on the sidelines.
3. Ethereum lagged Bitcoin so traders are not yet moving further out on the risk curve.
4. A hawkish Fed and a strong dollar are the main risks to the bullish view.
Bitcoin Analysis for Next Week: Bitcoin Gains 2.40% to $86,480 Inside a Tight Range
Bitcoin opened the week at $84,456.20 and dipped to a low of $82,570.72 on Monday. It then spent most of the week moving quietly, with the real move coming on Sunday when a late weekend rally pushed Bitcoin to a high of $86,766.
The rally came after news of MicroStrategy’s share offering. A quiet week followed by a sharp Sunday move suggests buyers were waiting for a reason to act, rather than sellers being in a hurry to exit.
This matters for Bitcoin Analysis because the 2.40% weekly gain came with very little weekday momentum. Sunday’s upward move now needs to prove that it can sustain itself.
Bitcoin Analysis for Next Week: ETH Lagging BTC at $2,726
Ethereum rose 1.44% to $2,726.64, lower than Bitcoin’s 2.40% gain. ETH made a high of $2,774 on Tuesday and fell to a low of $2,635.48 on Monday.
ETH continues to underperform Bitcoin. This shows that traders are still preferring the relatively safer large asset instead of moving further out on the risk curve. Bitcoin dominance at 58.9% also supports this view.
For ETH to start outperforming Bitcoin, we need to see ETF flows turn positive. Until then, Bitcoin remains the preferred asset among the two.
Bitcoin Analysis for Next Week: Why the Crypto Market This Week Held Up Against a Hawkish Fed
The macro backdrop turned harder this week. Stronger US jobs data on Friday pushed Fed futures to a hawkish repricing, with the odds of a 25 bps cut on 28 October near 72% and no hope left for a bigger 50 bps cut.
The US 2-year yield rose to 3.92%, the 10-year yield retook 3.97%, and the dollar index hit a multi-week high of 102.50. Normally, this combination puts pressure on crypto.
But liquidity absorbed the pressure. Stablecoin supply grew by over $1.20B, led by new USDT, while on-chain data showed one entity pulling over $410M of USDT and USDC off exchanges.
The implication for Bitcoin Analysis for Next Week is simple. The market is still liquidity-driven. Rising yields and a stronger dollar are the main things that could change the current setup.
Bitcoin Analysis for Next Week: Bitcoin ETF Flow Analysis Shows Institutions Buying Dips
US spot Bitcoin ETFs took in a net $241.1M this week.
The only outflow day came on quarter end and was mostly one fund, Fidelity's FBTC at $125.6M. That points to rebalancing, not a loss of confidence and the next two sessions confirmed it.
Flows were concentrated, not broad. BlackRock's IBIT led with +$195.6M on 1 October and +$158.2M on 2 October, while Grayscale, Bitwise and Fidelity saw outflows on other days.
Price action and flows agreed because dips were bought. For Bitcoin ETF flow analysis for next week, one more outflow day is noise. Two straight outflow days would be an early warning.
Bitcoin Analysis for Next Week: Top 3 Events Behind the Crypto Market This Week
MicroStrategy files for a multi billion dollar share offering to buy more Bitcoin
The filing gives the largest corporate holder a funding route for fresh purchases and it helped fuel Sunday's rally to $86.7K. A filing is permission to raise money, not a purchase, so the next signal is a disclosed buy.
SEC appeals the Ripple ruling on programmatic XRP sales
The SEC appeal caused midweek friction across major altcoins before buyers stepped back in. It reminds traders that regulatory risk sits mostly in altcoins which supports Bitcoin dominance and keeps the altcoin market outlook selective.
Standard Chartered launches Bitcoin and Ethereum custody in the UAE
A global bank offering spot custody makes it easier for institutions to hold crypto which offsets regulatory jitters. It adds to the case for steady institutional demand over the coming weeks.
Bitcoin Analysis for Next Week: Bitcoin Technical Analysis for Next Week Stays Bullish Above $82,000
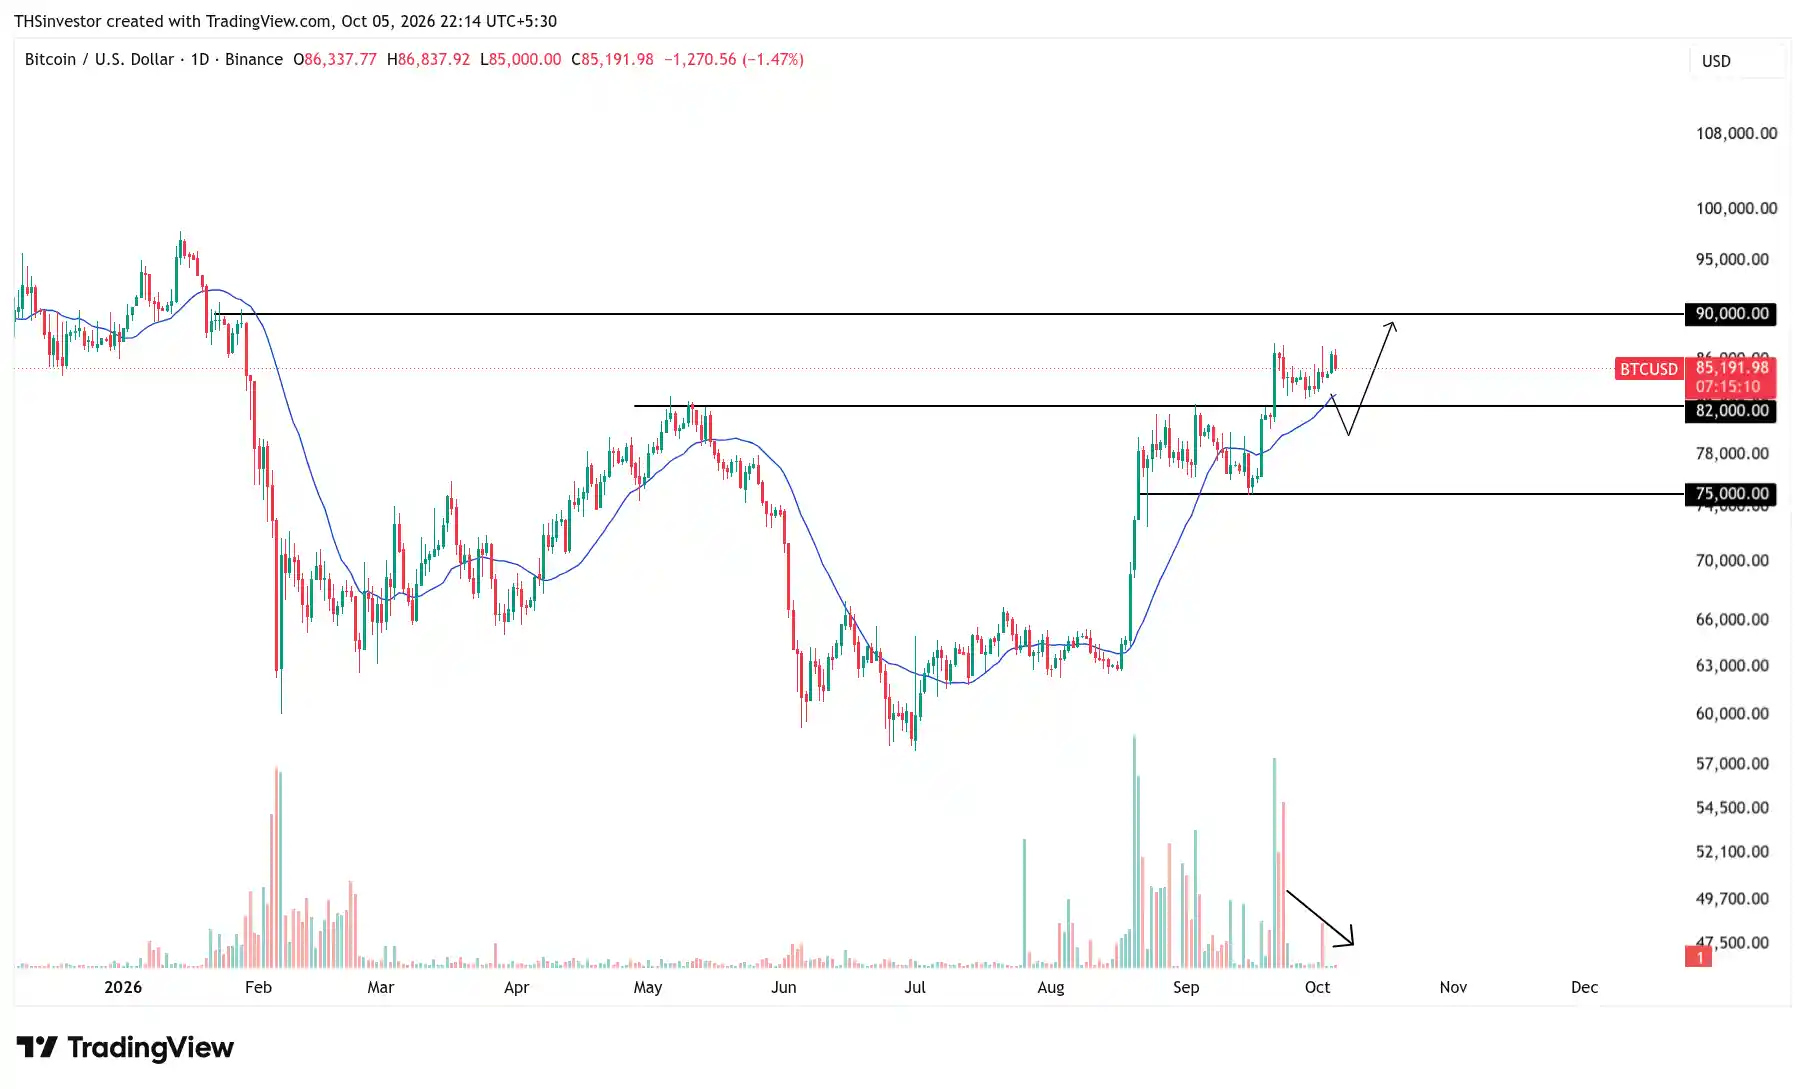
Now Bitcoin is consolidating between $82,000 and $87,000, while volume is drying up. We see this as a pause after the breakout, not a reversal.
Key Resistance: $87,000 is the top of the current range. The next major resistance is $90,000.
Key Support: $82,000 is the first support. The 21 EMA is sitting around this level. Buyers now need to defend the low of the breakout candle. If $82,000 breaks and Bitcoin holds below it, the market can turn sideways and move towards $75,000.
Momentum: The breakout candles came with high volume, showing real buying. The current pullback candles are indecisive and volume is low. This looks like a quiet pause but it also means the next move is not confirmed yet.
Near-Term Setup: Our most likely case remains unchanged from last week. Price could briefly dip below $82,000, trigger stop losses and then move higher. Watch volume closely for confirmation of the next move.
Bitcoin Analysis for Next Week: Bitcoin View for Next Week Across Most Likely, Bull and Bear Cases
The market view for Bitcoin Analysis for Next Week is bullish, liquidity driven and range bound. Institutional buying is absorbing the macro pressure but volume still needs to return to confirm the next leg. The key macro triggers are US yields and the dollar direction, ETF flows, and the Fed decision on 28 October.
Most Likely Case: The most likely case is that the range holds. Bitcoin may briefly dip below the support mentioned in the technical section, shake out weak hands and then recover. ETFs continue to see modest inflows, Ethereum stays behind Bitcoin and altcoins remain selective after the SEC Ripple appeal.
Bull Case: The bull case needs rising volume, cooling US yields, growing stablecoin supply and confirmed MicroStrategy purchases. A close above the range top mentioned in the technical section would confirm the move. Bitcoin is still around 31% below its $126K record so there is room for the move to continue.
Bear Case: The bear case would be triggered by higher yields, a stronger dollar, two or more days of ETF outflows or a risk-off shock. Reports of a plague-linked lab death in Siberia are still developing. Confirmed spread, travel bans, or oil and gold moving sharply higher would be the signs to watch. If the support mentioned in the technical section fails, altcoins would likely take the biggest hit.
Seasonality: Seasonality also helps the odds. October was green in 10 of 13 years from 2013 to 2025, with an average gain of 19.92% and a median gain of 14.71%. But October 2025 closed red after $19B in liquidations on 10 October. So, Uptober is an odds game, not a promise.
Our Bitcoin view for next week is simple: stay bullish above support, let volume confirm the move, and avoid shorting.

![What is the Real Value of Bitcoin and Other Cryptocurrencies? A Fundamental Perspective [2025]](https://thsinvestor.com/wp-content/uploads/2025/04/cryptocurrency-utility-768x384.webp)