

This Crypto Weekly Wrap was defined by one key question: can Bitcoin hold structure while ETF outflows continue accelerating?
So far, the answer is yes.
Spot Bitcoin ETFs still recorded roughly $1.26 billion in outflows during the week.
Despite that pressure, the $75,000 zone held firmly and buyers stepped in aggressively on dips. That suggests the market is seeing demand absorption rather than a structural breakdown.
The bigger picture is important here. ETF outflows currently look more like institutional de risking instead of permanent capital exit from crypto. Long term positioning still remains active beneath the surface.
Institutional accumulation also continued during the week. Strategy disclosed another $2.01 billion Bitcoin purchase funded through preferred stock issuance, while Bitmine Immersion Technologies accumulated roughly 71,000 ETH.
At the same time, long term holder Bitcoin supply climbed above 16.3 million BTC, showing conviction from stronger hands remains intact despite short term volatility.
From a Bitcoin technical analysis perspective, the market remains stuck inside a key range between $75,000 and $78,000. That remains a no trade zone for strong directional positioning.
A breakout above $78,000 would improve momentum significantly, while a breakdown below $75,000 would shift the structure bearish again.
Crypto Weekly Wrap: Bitcoin Defends $75K Under Pressure
Bitcoin opened this Crypto Weekly Wrap near $77,435 and remained relatively stable until Friday’s macro driven selloff pushed price toward $75,500.
That level held firmly.
Bitcoin then recovered by Saturday, but the important detail is how the bounce happened. ETF inflows did not drive the recovery. The move came mainly from short covering and long term holders refusing to sell into weakness.
That matters because when price falls sharply but long term holder supply stays stable, it usually signals controlled dip buying instead of panic capitulation.
The $75,000 zone is now the most important support level in the current Bitcoin technical analysis structure. It aligns with the previous swing low and has now been defended multiple times.
As long as Bitcoin holds above $75,000, the broader consolidation structure remains intact.
The next major resistance sits near $78,000. A clean breakout above that zone can open the path toward $82,000, especially if macro conditions improve and global risk sentiment stabilises.
On the downside, losing $75,000 would weaken the structure significantly and increase the probability of a deeper move toward the $70,000 to $71,000 support zone.
Crypto Weekly Wrap: Ethereum Holds Ground While Bitmine Accumulates 71,000 ETH
Ethereum traded between $2,020 and $2,153 during this Crypto Weekly Wrap. The low came during Friday’s broader market selloff, but ETH recovered faster than Bitcoin on Saturday, showing relative resilience instead of major weakness.
ETH dominance held near 9.62%. That is still a compressed level, which means broad altcoin rotation into Ethereum has not started yet. But stability at these levels is important because it shows capital is no longer aggressively leaving ETH.
The biggest institutional signal came from Bitmine Immersion Technologies, which accumulated more than 71,000 ETH during the week. Chairman Tom Lee described the $2,000 to $2,100 zone as a long term accumulation area, with the company targeting 5% of circulating ETH supply over time.
That is one of the largest active corporate Ethereum accumulation programs in the market right now.
Ethereum’s long term fundamentals also remain intact through staking, DeFi infrastructure, and stablecoin settlement activity. But in the short term, ETH is still trading largely in line with Bitcoin and broader crypto sentiment.
From an Ethereum technical analysis perspective, the key support remains near $2,020 while resistance sits near $2,153. A breakout above $2,200 would be the first sign of stronger independent momentum.
On the downside, losing the $2,000 level would weaken structure and open the path toward deeper support near $1,900.
Crypto Weekly Wrap: The Forces Behind This Week's Pressure and Recovery
Three overlapping forces shaped this week's price action.
First, macro headwinds intensified. Japanese investors sold $29.6 billion of US government debt in Q1, the largest quarterly net sale since Q2 2022. This pushed Treasury yields higher. Higher yields compress risk asset valuations across equities and crypto. Bitcoin is not immune to yield shocks, and the timing of Friday's selloff aligned directly with this macro pressure.
Second, ETF outflows accelerated. The week saw $1.256 billion exit spot Bitcoin ETFs across five consecutive sessions. Monday alone saw $648.64 million in redemptions. IBIT absorbed the largest single-session hit at $448 million. This is institutional hedging, not institutional exit. The distinction is critical. Hedging means position sizing is being adjusted. Exit means capital is being withdrawn permanently. The evidence points to the former.
Third, corporate accumulation continued. Strategy disclosed a $2.01 billion BTC purchase funded by STRC preferred stock sales. The average entry price was $80,985. This means Strategy bought above current market levels and has not sold. Bitmine bought 71,000 ETH. These are not momentum trades. They are structured, long-duration positions built on conviction about digital asset fundamentals.
The macro force pushed price lower. Corporate accumulation provided the floor. The net result was a controlled correction that did not break structure.
Crypto Weekly Wrap: ETF Outflows of $1.26B Signal Caution, Not Capitulation
Spot Bitcoin ETF flows were the biggest institutional signal during this Crypto Weekly Wrap.
Total outflows reached roughly $1.26 billion during the week, marking the largest weekly redemption since February 2026. ETF assets under management also slipped below $99 billion.
The important detail was the flow pattern. Selling pressure was strongest early in the week and gradually slowed later on. That usually signals tactical repositioning instead of a full institutional exit from crypto.
BlackRock’s IBIT saw the largest redemptions, but it also remained the main institutional vehicle during recovery sessions. That behaviour suggests institutions are reducing exposure during uncertainty and rebuilding positions during consolidation phases.
Another important signal came from altcoin ETF products. XRP and SOL ETFs continued attracting inflows while smaller flows also moved toward LINK, HBAR, DOGE, and HYPE products.
That matters because it shows capital is not fully leaving crypto. Some institutional money is rotating selectively into altcoin products even while Bitcoin ETFs remain under pressure.
The bigger takeaway is that ETF flows still remain the main directional indicator for crypto markets.
A strong return of Bitcoin ETF inflows would likely support another move toward $78,000 and higher. But another sharp acceleration in outflows would signal institutions are moving back into defensive positioning again.
For now, institutions are not gone from the market. They are waiting for stronger macro clarity before increasing exposure again.
Key Events That Shaped This Crypto Weekly Wrap
Strategy's $2.01 Billion Bitcoin Purchase
Strategy disclosed the acquisition of 24,869 BTC for $2.01 billion, funded almost entirely by STRC preferred stock sales. The average price was $80,985 per coin, above current market levels. Total holdings reached 843,738 BTC. By May 24, Saylor confirmed Strategy bought bonds rather than bitcoin during the current week, signalling a deliberate pause to manage debt before the next accumulation cycle. This purchase is the second-largest single-week acquisition of 2026. It confirms the corporate accumulation playbook remains active regardless of price direction. The fact that Strategy bought above $80,000 and is now sitting on unrealised losses is not a red flag. It is a signal that their time horizon is measured in years, not weeks.
Bitmine Accumulates 71,000 ETH as Tom Lee Calls the Dip Attractive
Ethereum treasury firm Bitmine purchased over 71,000 ETH last week, a sharp increase from previous weeks. Chairman Tom Lee framed the $2,000 to $2,100 price range as an attractive accumulation opportunity and stated the firm expects to hold 5% of all circulating ETH supply before year-end. This is the largest active corporate ETH accumulation program in the market. It provides structural demand support beneath current ETH prices and signals institutional confidence in Ethereum's long-term role in decentralised finance and stablecoin infrastructure.
Japan Sells $29.6B in US Debt, Triggering Treasury Yield Pressure on Bitcoin
Japanese investors sold $29.6 billion of US government, agency, and local authority debt in Q1 2026. This was the largest quarterly net sale since Q2 2022. The catalyst was a reversal in Federal Reserve rate expectations triggered by rising oil prices. Higher Treasury yields create direct headwinds for Bitcoin by raising the opportunity cost of holding risk assets. The Friday selloff that pushed Bitcoin to $74,255 was directly connected to this macro dynamic. This event explains why ETF outflows were front-loaded on Monday and why institutional hedging accelerated mid-week. The macro-to-crypto transmission mechanism is working exactly as expected.
Crypto Weekly Wrap: AI and DeFi Lead as Speculative Sectors Retreat
Sector rotation this week told a clear story. Capital moved toward infrastructure and productive yield. It moved away from speculative momentum.
According to CoinMarketCap, AI tokens led the week with 12.4% gains. The SEC's signals on third-party tokenized stocks gave AI-adjacent infrastructure a legitimacy boost.
Key insight: The sector rotation this week was quality-driven. Traders moved toward protocols with visible utility and yield. They moved away from tokens driven by narrative and speculation. This is typical of mid-consolidation positioning where smart money builds in productive sectors before a broader breakout.
The absence of broad meme coin participation confirms that Bitcoin dominance at 58.1% is still suppressing speculative rotation. The next wave of altcoin momentum will require BTC to break above $78,000 and hold it.
Crypto Weekly Wrap: Breadth Swings Reveal a Market Without Conviction
Market breadth during this Crypto Weekly Wrap remained highly unstable, which reflects a market still lacking strong directional conviction.
The advance decline ratio moved sharply throughout the week, rising to 5.00 on Thursday before collapsing to 0.15 on Friday. That kind of volatility in breadth usually signals buyers and sellers are both active, but neither side is maintaining control for long.
What matters next is consistency. Sustained breadth above 2.50 for multiple sessions would signal buyers are regaining control across the crypto market.
On the other hand, weak breadth combined with a Bitcoin breakdown below $75,000 would strengthen the bearish scenario significantly.
Bitcoin Technical Analysis: $75K Floor Holds, $78K Is the Level That Matters
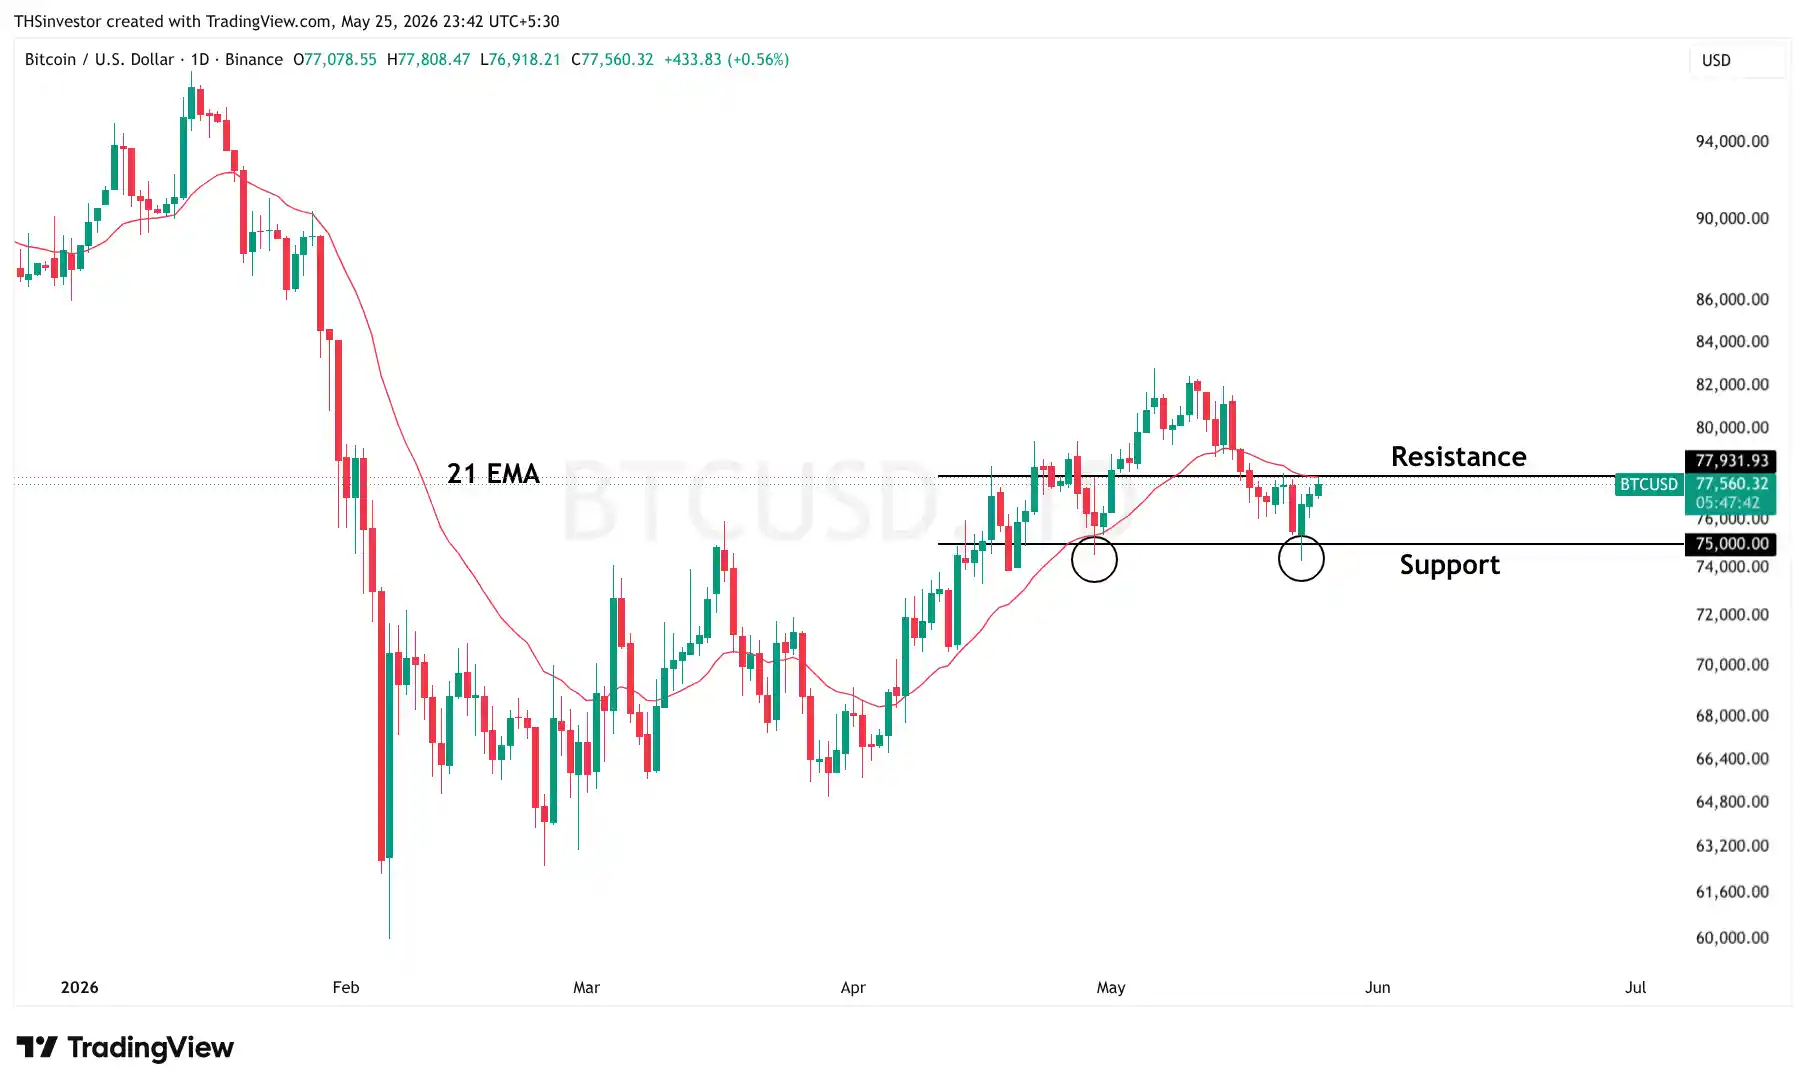
Bitcoin dropped during the week, found strong demand near the $75,000 zone, and recovered without confirming a breakdown. That matters because $75,000 also aligns with the previous major swing low, making it a structurally important support level that has now held multiple tests.
The immediate resistance now sits near $78,000.
That level coincides with the 21 day EMA on the daily chart, which continues acting as dynamic resistance during the current correction phase. Bitcoin has still not managed a strong close above this level since the April peak.
Right now, the $75,000 to $78,000 range remains a no trade zone. The market is consolidating and waiting for confirmation before the next larger move begins.
For bullish positioning, the cleaner setup comes only after a confirmed daily close above $78,000. That would improve short term structure and open the path toward $82,000, especially if macro conditions and global risk sentiment continue improving.
For bearish positioning, the trigger remains a confirmed breakdown below $75,000. Losing that support would weaken the broader structure and expose the next major downside zone near $70,000 to $71,000.
Inside the current range, risk reward remains poor for aggressive positioning. Patience is the better trade until the market confirms direction.
Crypto Weekly Wrap Outlook: Three Scenarios for the Week Ahead
The crypto market enters next week with a tested but still intact structure.
Bitcoin successfully defended the $75,000 zone while ETF outflows also started slowing toward the end of the week. At the same time, corporate accumulation from companies like Strategy and Bitmine Immersion Technologies continues providing structural support underneath the market.
The biggest macro variable now is Treasury yields and global risk sentiment. But improving US Iran diplomatic signals are becoming an important potential tailwind for crypto and broader risk assets.
The base case for this Crypto Weekly Wrap remains consolidation between $75,000 and $78,000 during the early part of next week. If ETF flows stabilise and Bitcoin reclaims the 21 day EMA near $78,000, the market can open the path toward $82,000.
The bullish scenario depends mainly on macro improvement. A stronger global risk rally or positive US Iran developments could quickly push Bitcoin toward the $82,000 to $84,000 zone while bringing ETF inflows back into the market.
The bearish scenario remains tied to rising Treasury yields and renewed ETF selling pressure. If Bitcoin loses the $75,000 support zone on high volume, the next major downside area sits near $70,000 to $71,000.
The key takeaway is that the market still remains inside a major decision zone between $75,000 and $78,000. Confirmation now needs to come from actual price action and ETF flows, not speculation alone.