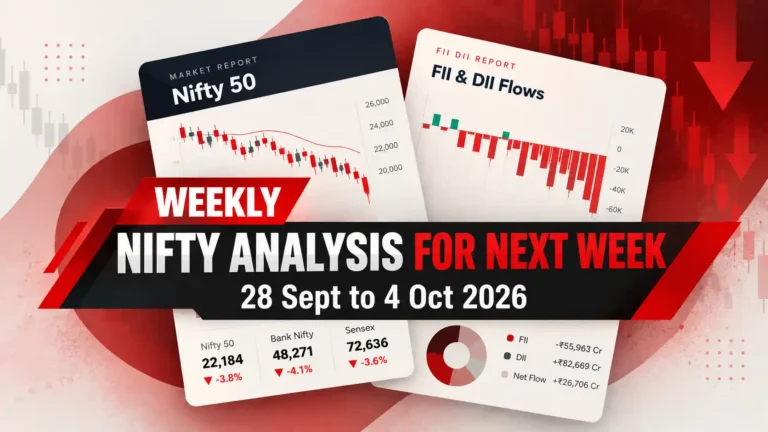

Nifty Analysis for Next Week starts with one clear message: the bounce is over and bears are back in control. Nifty closed at 22,600, down 2.36%, wiping out last week’s 2.78% gain. Bank Nifty fell 2.79% to 54,287. On Friday, 457 Nifty 500 stocks closed lower and only 39 closed higher. This was broad-based selling.
Crude above $100, foreign selling and leveraged retail positions under pressure keep the outlook bearish. Our Nifty view for next week is simple: sell on rises and avoid going long until strength returns. The next expiry is on Tuesday, 27 October, so expect volatility in the first two sessions.
Key takeaways:
1. Bears are in control. Last week’s bounce was a pullback within a broader downtrend.
2. FIIs sold while DIIs bought ₹10,942 crore. The index still fell. Domestic money is defending the market but not driving it higher.
3. Weakness is widespread. Midcaps and smallcaps fell harder than Nifty.
4. Crude above $100 is limiting any recovery. Until oil cools, rallies remain selling opportunities.
Support and resistance levels are covered in the technical section below.
Nifty Analysis for Next Week: Nifty overview
Nifty opened the week at 23,146 and hit its weekly high of 23,175.25 on Monday. It then sold off and closed the day down 1.11%. Buyers could not hold the high even for one session.
Tuesday was a Dussehra holiday. Nifty then fell to a low of 22,372 on Friday before closing at 22,600. The 2.36% weekly loss erased nearly all of last week’s gains.
Crude oil was the main pressure point. West Asia tensions pushed oil above $100 a barrel. Since India imports most of its oil, higher prices increase inflation and the current account deficit while squeezing company margins. This added pressure to an already weak market.
Midcap 100 fell 5.63% and Smallcap 100 dropped 7.27% in four sessions. This was their steepest weekly decline since February 2025. The weakness is widespread.
For Nifty Analysis for Next Week, the takeaway is clear. Rallies are likely to face selling until the broader market stabilises. Watch smallcaps before trusting any recovery.
Nifty Analysis for Next Week: BankNifty overview
Bank Nifty opened at 55,844, hit its weekly high of 55,883.70 on Monday and never returned to that level. It closed at 54,287.35, down 2.79%, after hitting a weekly low of 53,942.35 on Friday. This was a steeper fall than Nifty’s 2.36% decline.
Banks had been relatively stronger this year. Bank Nifty is down 8.89% YTD against Nifty’s 13.51% fall. That relative strength is now weakening, with Financial Services falling 3.79% this week. When the leader starts falling, the rest of the market loses support.
Credit growth adds to the pressure. Loan growth is expected at 13.4%, down from 18.2%, while deposit growth is forecast at 11.9%, against 16.7% earlier. High crude prices also reduce the chances of rate cuts, removing a potential support for banks.
For Nifty Analysis for Next Week, Bank Nifty is the index to watch for confirmation. A recovery led by IT is narrow. A recovery led by banks is more convincing.
Nifty Analysis for Next Week: Important developments
Jio Platforms IPO Closes at 22.19x as India's Largest Ever Issue
The ₹30,213 crore Jio Platforms IPO closed on 23 October with 22.19x subscription. A large amount of institutional and retail money was parked in one IPO while the secondary market fell. This reduced available liquidity when the market needed it most. The listing is the next trigger. A strong debut would show that risk appetite remains intact. A weak debut would suggest that even the most sought-after stocks are struggling to attract buyers. Refunds to unsuccessful bidders could also flow back into the market and provide a short-term lift.
Midcap and Smallcap Indices Post Worst Weekly Fall Since February 2025
Smallcap 100 and Midcap 100 are where retail and leveraged money is concentrated. Such a sharp fall shows weakening risk appetite among smaller traders. It also weakens the buyer base that usually supports the market when FIIs sell. Watch for smallcaps to stabilise first. This could be an early sign that selling pressure is easing. If they continue to fall, the frontline indices could follow.
West Asia Tension Keeps Crude Above $100 and Hits Oil-Heavy Sectors
Higher oil prices raise costs for aviation, logistics, paints and chemicals and squeeze their margins. Upstream oil producers can benefit but they were also sold this week. Watch whether crude stays above $100 alongside the rupee and the FX Reserves data on 30 October. A ceasefire could lift the market quickly while a supply disruption could trigger a sharp fall.
Nifty Analysis for Next Week: FIIs Sold, DIIs Bought
FIIs sold a net ₹2,697.37 crore in cash this week. DIIs bought ₹10,942.19 crore about four times as much, yet Nifty still fell 2.36%. Domestic money is defending the floor but not lifting the market.
Thursday saw the biggest FII selling at ₹3,458.70 crore, followed by ₹1,148.64 crore on Monday. The two buying days were smaller: ₹1,022.32 crore on Wednesday and ₹887.65 crore on Friday. Small cash buying changes little while the futures book remains bearish.
The FII long-short ratio in index futures has stayed between 8% and 11% since early October. This points to a heavily short position, with little sign of covering. They are buying some cash stocks while keeping their shorts, suggesting a hedge rather than a bet on recovery.
High crude prices put pressure on the rupee and current account, meaning FIIs need greater returns to justify holding Indian assets. The KOSPI has also fallen nearly 41% from its peak amid the AI and data centre selloff, showing that global funds are cutting risk across Asia. India’s liquidity makes it an easy market to sell. US 10-year yields slipping below 5% offered some relief but not enough to bring FIIs back.
The second pressure is domestic leverage. Margin Trading Funding (MTF), the funding brokers provide to traders, has reached ₹1.48 lakh crore. About 79% of this exposure is in stocks trading below buyers’ average prices, while around 40% of positions are at least 10% underwater. This is stock-level data, not client-level data, so it does not mean 79% of traders are losing money. It does show how much borrowed money is tied up in losing stocks.
Forced selling ignores valuations. This is one reason smallcaps fell around 7% while Nifty declined much less. DIIs bought ₹3,235.36 crore on Friday alone. But if they have to absorb FII exits and margin-driven liquidation together, they cannot support the market indefinitely.
Nifty Analysis for Next Week comes down to one question: will FIIs start covering shorts, or will domestic leverage begin to unwind? Right now, the risk of leverage-driven selling looks greater than the chance of a meaningful FII recovery.
Nifty Analysis for Next Week: Only IT Held Up
IT was the only sector to finish in the green, up 4.15%. Everything else fell. Capital Markets (-6.96%) and Defence (-6.91%) were the worst performers. Both are crowded, high-beta trades. When investors want out, they sell what they can exit fastest.
The sharp fall in Capital Markets stocks also signals concerns about retail trading volumes and margin activity. The market is pricing in lower participation and stress in leveraged positions.
Even sectors that should benefit from high crude prices were sold. Energy fell 4.68% and Oil & Gas dropped 2.11%. This points to a liquidity-driven exit rather than sector rotation. When even potential beneficiaries fall, buyers are stepping away across the board.
IT was the only pocket of strength, but we would not trust it yet. The sector is still down 14.42% YTD, and the weak rupee has helped. With the global AI selloff underway, this bounce could reverse quickly. It looks like a relief trade, not new leadership.
The defensive story is weakening too. FMCG is down 21.19% YTD, its worst year on record, worse than its 2008 decline of 19.58%. High inflation, weak rural demand, lower disposable income due to taxes and a weak job market are hurting consumers. Even the sector where investors usually seek safety is struggling.
Nifty Analysis for Next Week: Nifty Option Chain Analysis
Nifty option chain analysis for next week starts with the PCR at 0.74. Far more calls than puts are being written, suggesting option writers are not expecting a rally. They are selling the upside and collecting premiums as long as Nifty stays below the call wall.
India VIX closed at 16.86 after rising 6.96% on Friday. A rising VIX alongside a falling market means traders are paying more for protection. This bearish combination signals larger daily swings, so position sizes should be smaller.
The Nifty option chain points to a market capped on the upside and fragile on the downside.You can track live OI changes on the NSE India website.
Nifty Analysis for Next Week: Technical Analysis
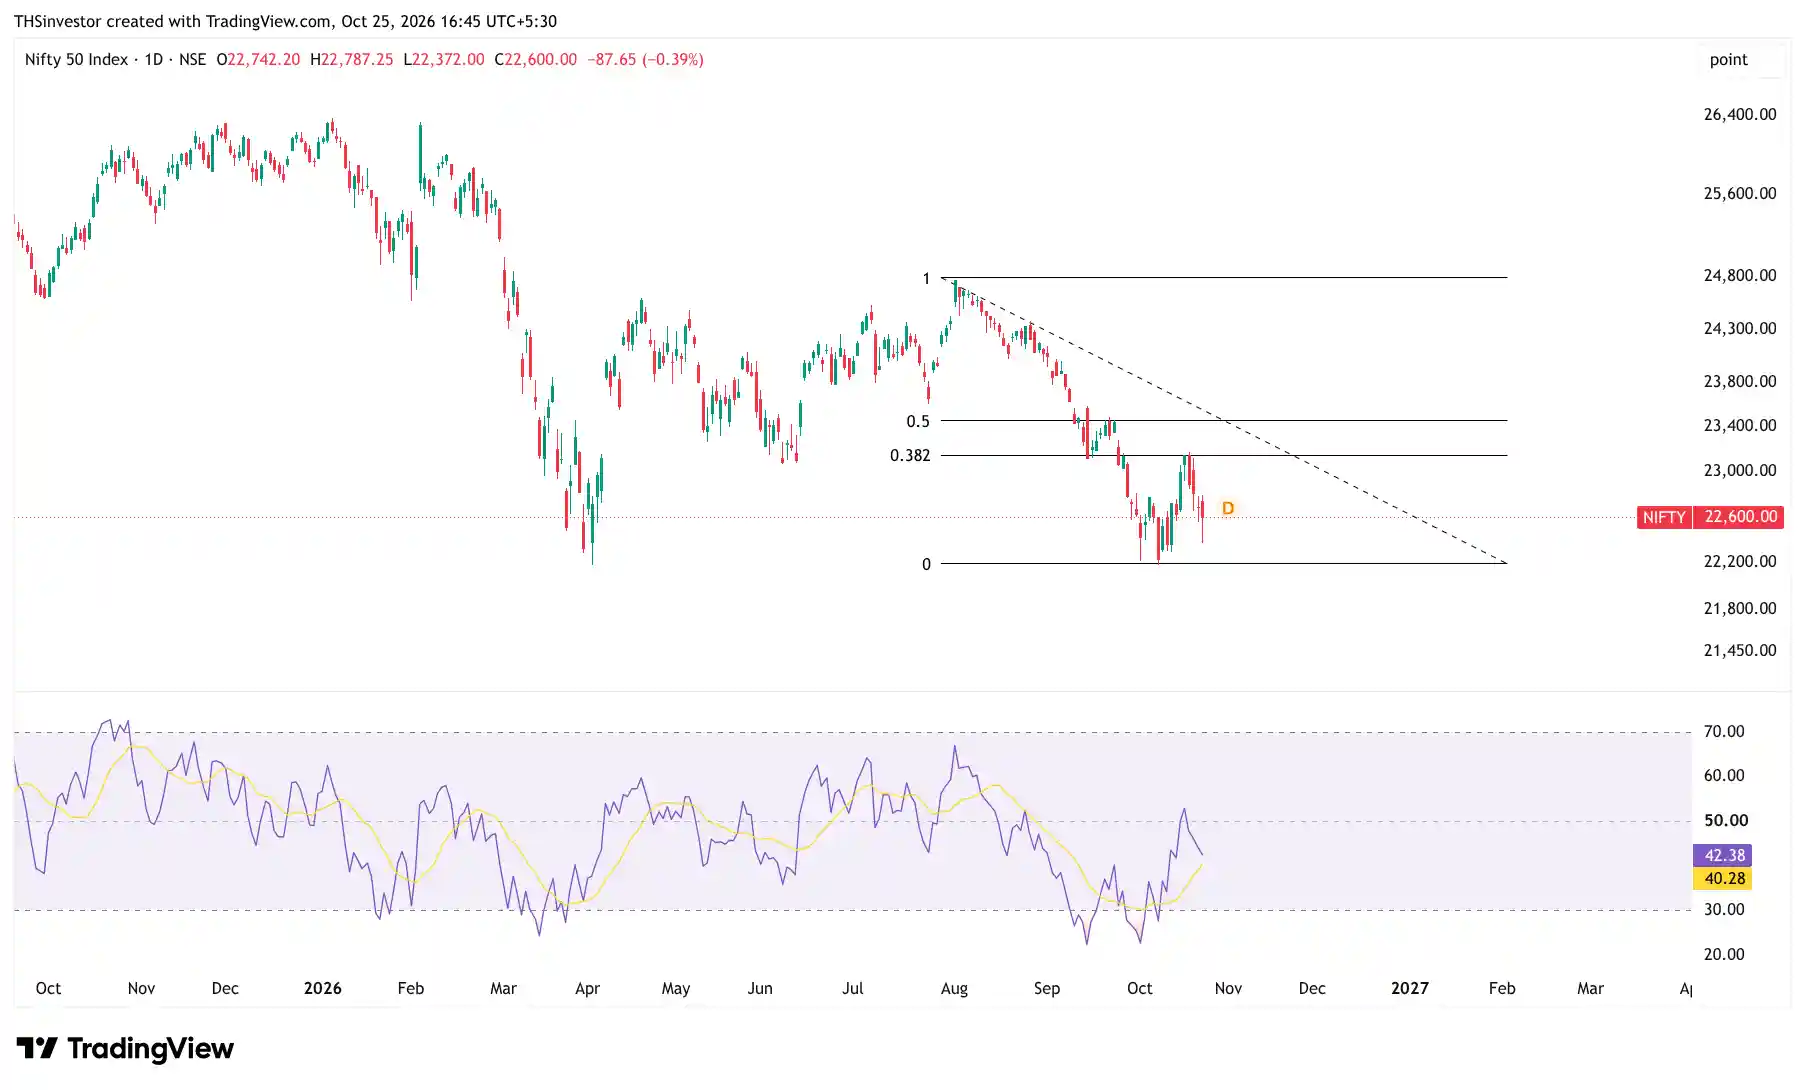
For Nifty Analysis for Next Week, every bounce remains a selling opportunity until the trend changes. The first resistance is 22,800-22,850, where the 20-day EMA sits. The major hurdle is 23,200, the 38.2% Fibonacci retracement of the previous fall where this week’s recovery attempt failed. Only a daily close above 23,200 would suggest a possible bottom.
On the downside, the first support is 22,350-22,300, followed by the 22,200-22,000 zone. The 22,000 level is the final line of defence. Nifty has spent four weekly candles near this zone. The longer price stays on support, the more buyers get exhausted and the weaker the support becomes.
A break below 22,000 could trigger sharp selling. Daily RSI is sliding towards 40. A move below this level would confirm further bearish momentum and reduce the chances of a quick bounce.
The weakness is widespread. Midcap and Smallcap indices are below key daily moving averages. The Smallcap index also fell below its 200-day EMA for the first time since 16 April.
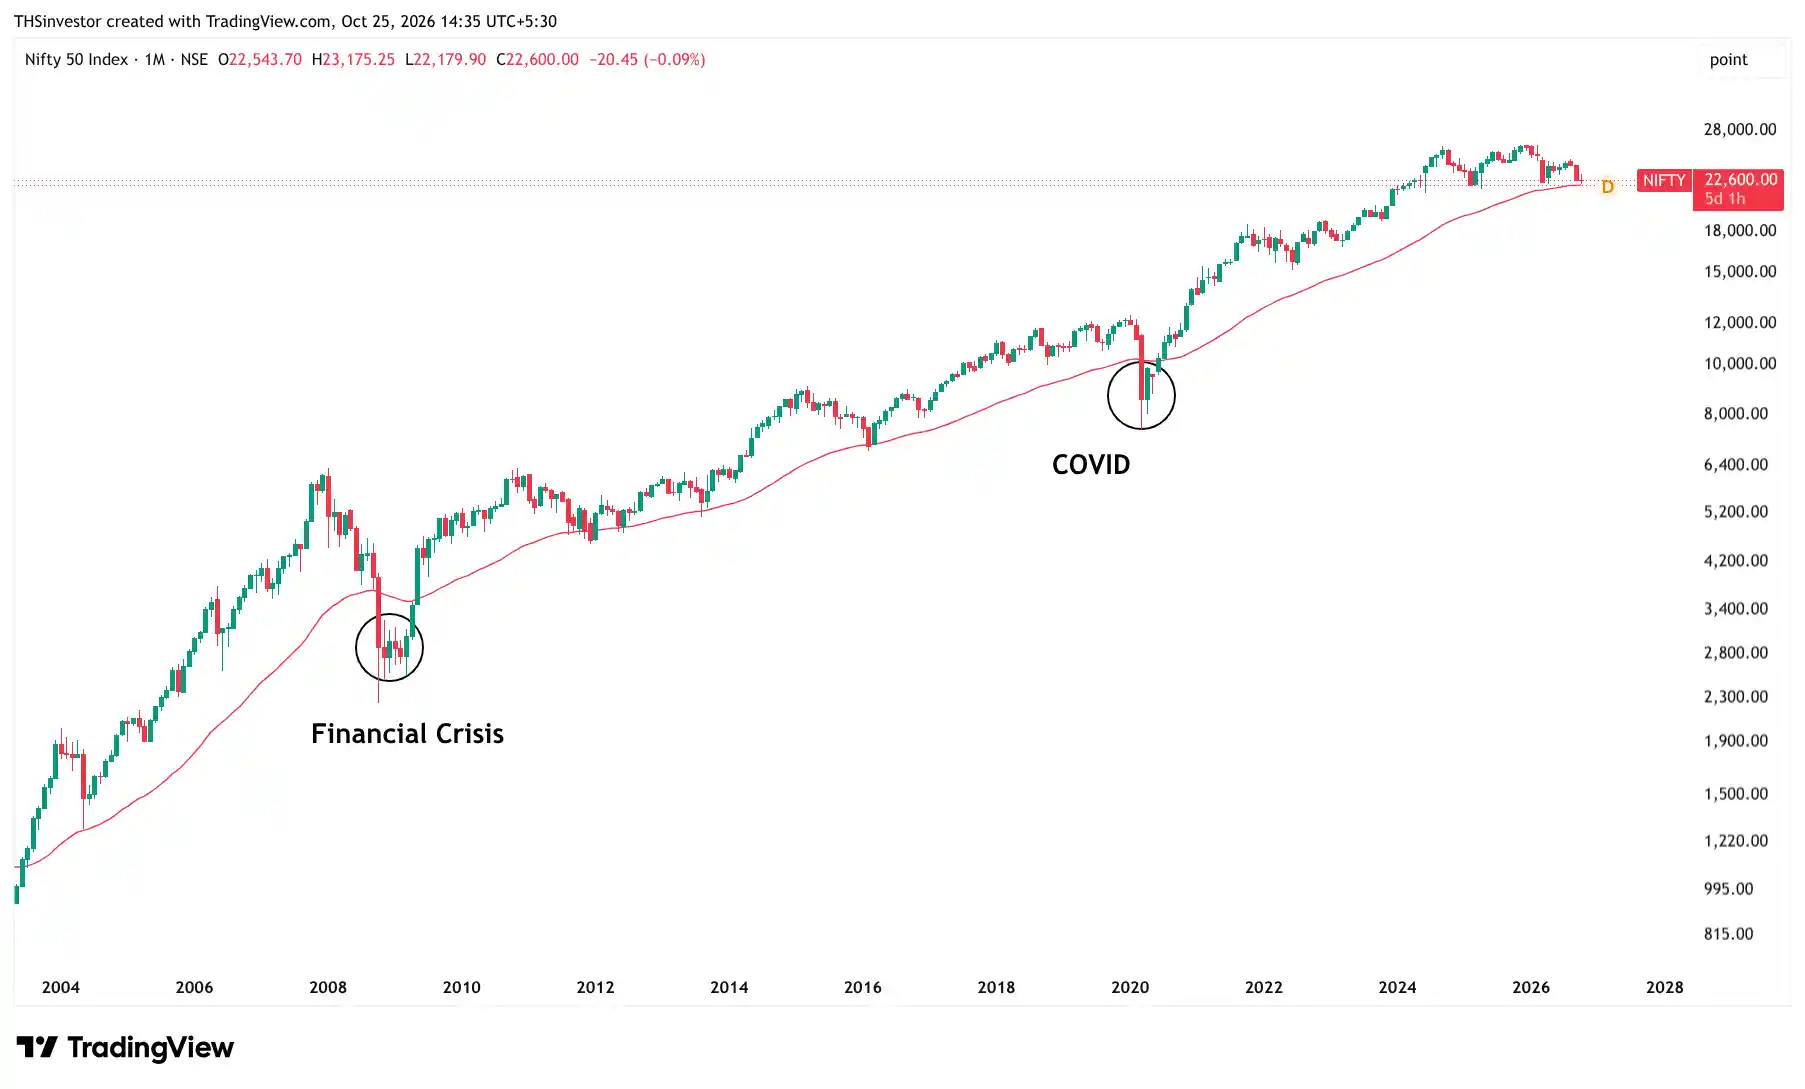
The monthly chart is the only bright spot. Nifty has broken its monthly 50 EMA only twice since 2003: during the 2008 financial crisis and the Covid crash. It is now sitting just above this line. The developing monthly doji hints at a possible pause, but confirmation is still needed.
This is why 22,000 matters so much. A break below it could trigger algorithmic selling and accelerate the decline.
Our bias remains sell on rise, with no longs against the trend until strength returns. Bottoms form when nobody expects them, but the chart must confirm it first. A daily close above 23,200 would challenge this bearish view, while a close below 22,000 would confirm that the base has failed.
Nifty Analysis for Next Week: Sell on Rise
Our view for Nifty Analysis for Next Week is bearish. Every bounce this week faced selling.
Nifty is likely to remain weak with sellers emerging near resistance. The 27 October expiry could pull the index towards the 22,700 Max Pain level but we would treat any bounce as a selling opportunity.
Crude above $100 and ongoing West Asia tensions keep inflation and margin concerns high. FIIs remain heavily short in index futures while DIIs are buying ₹1,600-₹3,200 crore daily. This is supporting the market but not driving a recovery.
IT and Pharma may hold up better while Capital Markets, Realty, Defence and smallcaps remain vulnerable. If support breaks, margin calls could trigger forced selling alongside FII exits.
Key data to watch includes Industrial Production on 28 October, FX Reserves on 30 October and bank loan growth. Weak data could add to market pressure. Official data is on the RBI website.
On the upside, the signal is simple: a daily close above the resistance level in the technical section, ideally with smallcaps stabilising, would suggest selling pressure is easing. Until then, we would treat rallies as selling opportunities rather than chase the market.
Key Events to Watch Next Week
| Event | Date | Forecast | Previous |
|---|---|---|---|
| Industrial Production (YoY) (Sep) | 28 Oct | 3.4 | 8.0 |
| Cumulative Industrial Production (Sep) | 28 Oct | 5.2 | 6.70 |
| Manufacturing Output (MoM) (Sep) | 28 Oct | 4.1 | 9.0 |
| M3 Money Supply | 28 Oct | 12.1 | 16.9 |
| Federal Fiscal Deficit (Sep) | 30 Oct | NA | 7102.49 |
| FX Reserves USD | 30 Oct | 718.0 | 721.83 |
| RBI Monetary and Credit Information Review | 30 Oct | NA | NA |
| Bank Loan Growth | 30 Oct | 13.4 | 18.2 |
| Deposit Growth | 30 Oct | 11.9 | 16.7 |
IPO Tracker This Week
| Company | M.Cap (Cr) | P/E | ROCE | Subscription |
|---|---|---|---|---|
| Core4 Engineers | ₹192.35 | 18.06 | 13.23 | 0.06xx |
| EAAA India Alternatives | ₹10765.10 | 33.35 | 28.96 | N/Ax |
| SFC Environmental Technologies | ₹3232.57 | 19.97 | 22.21 | N/Ax |
| BLS Polymers | ₹930.48 | 22.74 | 29.51 | N/Ax |
| Wiscon Industries | ₹407.75 | 20.00 | 51.82 | N/Ax |
| M.K.Sons Fine Jewels | ₹630.00 | 12.13 | 39.88 | N/Ax |
| Carver Roboweld | ₹104.82 | 21.57 | 21.64 | N/Ax |
| Bombay Coated & Special Steels | ₹610.20 | 16.40 | 16.40 | N/Ax |