
This Bitcoin Analysis for Next Week covers October 12 to 18, 2026. Bitcoin ended the week near $82,000, down about 2%. Our market view remains range-bound till a decisive candle, either side.
The main driver was higher-than-expected US inflation revived fears of another Fed rate hike, pushing traders away from risk assets like Crypto. Bitcoin held up better than Ether and most altcoins, but buying remained weak.
This Bitcoin weekly analysis explains what drove the market, what big money is doing, and what to watch next. The technical analysis is covered in a separate section below.
Key takeaways:
- Rate hike fears, not Bitcoin-specific news, drove the market this week.
- ETF outflows slowed by about two-thirds, suggesting that big money is reducing exposure rather than leaving the market entirely.
- Ether fell more than twice as much as Bitcoin, showing that traders cut riskier positions first.
- Bitcoin dominance at 60.2% shows that money is favouring Bitcoin over altcoins.
Bitcoin Analysis for Next Week: What Bitcoin Did This Week
Bitcoin opened the week at $83,801, reached a high of $84,109 on Monday and fell to a low of $79,800 on Thursday. It closed at $81,989, down about 2%.
The week remained quiet. The price is trading in a small range with small candles and low volume. Total crypto market value stands near $2.74T according to CoinMarketCap and Bitcoin makes up about 60% of it. For the Bitcoin Analysis for Next Week, that means Bitcoin’s own direction sets the mood for the whole market.
Bitcoin Analysis for Next Week: Ethereum drops 5%
Ether opened the week at $2,544, reached $2,576 on Monday and fell to $2,320 on Thursday. It closed at $2,408, down 5.35%. That is more than twice Bitcoin’s loss.
The gap is about leverage, not bad Ethereum news. Ether is the high beta version of Bitcoin, which means it moves more in both directions. It needs calmer macros like bond yields before it can outperform.
Bitcoin Analysis for Next Week: Rate Hike Fear Drove the Market
The main driver was rising interest rate fears. US inflation came in at 3.7%, above the 3.6% forecast, pushing the probability of another Fed rate hike close to 50% before it cooled to around 30%.
The 10-year US Treasury yield is near 5.3%, making bonds more attractive than Bitcoin. A stronger dollar added further pressure. Strategy also slowed its Bitcoin purchases, adding just 267 BTC worth about $22 million, according to its SEC filing
Higher yields, weaker institutional buying and leveraged liquidations are keeping Bitcoin under pressure.
Bitcoin Analysis for Next Week: Bitcoin ETF Flow
US spot Bitcoin ETFs lost $228.4 million this week, marking a second consecutive week of outflows.
Daily flows followed price movements. Funds saw outflows on Monday, inflows during Tuesday’s bounce, heavy outflows after Wednesday’s inflation report, little change on Thursday and further outflows on Friday.
Bitcoin Analysis for Next Week: Important Developments
JPMorgan Brings JPM Coin to the Ethereum
JPMorgan’s JPMD now runs on Ethereum and Base. It is a digital version of money held in a bank account. Unlike a stablecoin, it represents money deposited with JPMorgan. Only approved institutional clients can use it to make payments, settle trades and provide collateral. This is positive for Ethereum in the long term because banks can move money and settle transactions more easily using blockchain technology.
Visa Moves Stablecoin Payouts From Pilot to Production
On October 15, Visa moved its stablecoin payout service from testing to live use, with Inyo Global as its first partner. Businesses can now use USDC to fund cross-border payouts around the clock across more than 180 countries and territories. This shows that stablecoins are becoming part of mainstream payment systems. I
France Backs a 31.4% Tax on Crypto to Stablecoin Swaps
France’s Finance Committee backed a proposed 31.4% tax on converting crypto into MiCA-approved stablecoins, such as USDC and EURC. The tax could take effect on January 1, 2027, but the proposal is not law yet. USDT would be exempt because it lacks MiCA approval. This could put regulated stablecoins at a disadvantage. The National Assembly is due to vote on the budget revenue section on October 20. The same package also includes a proposed exit tax on crypto holdings above €800,000. Chainalysis warned that the measures could push traders towards offshore platforms. If passed, the tax could reduce demand for regulated euro-linked stablecoins.
Bitcoin Analysis for Next Week: Technical Analysis
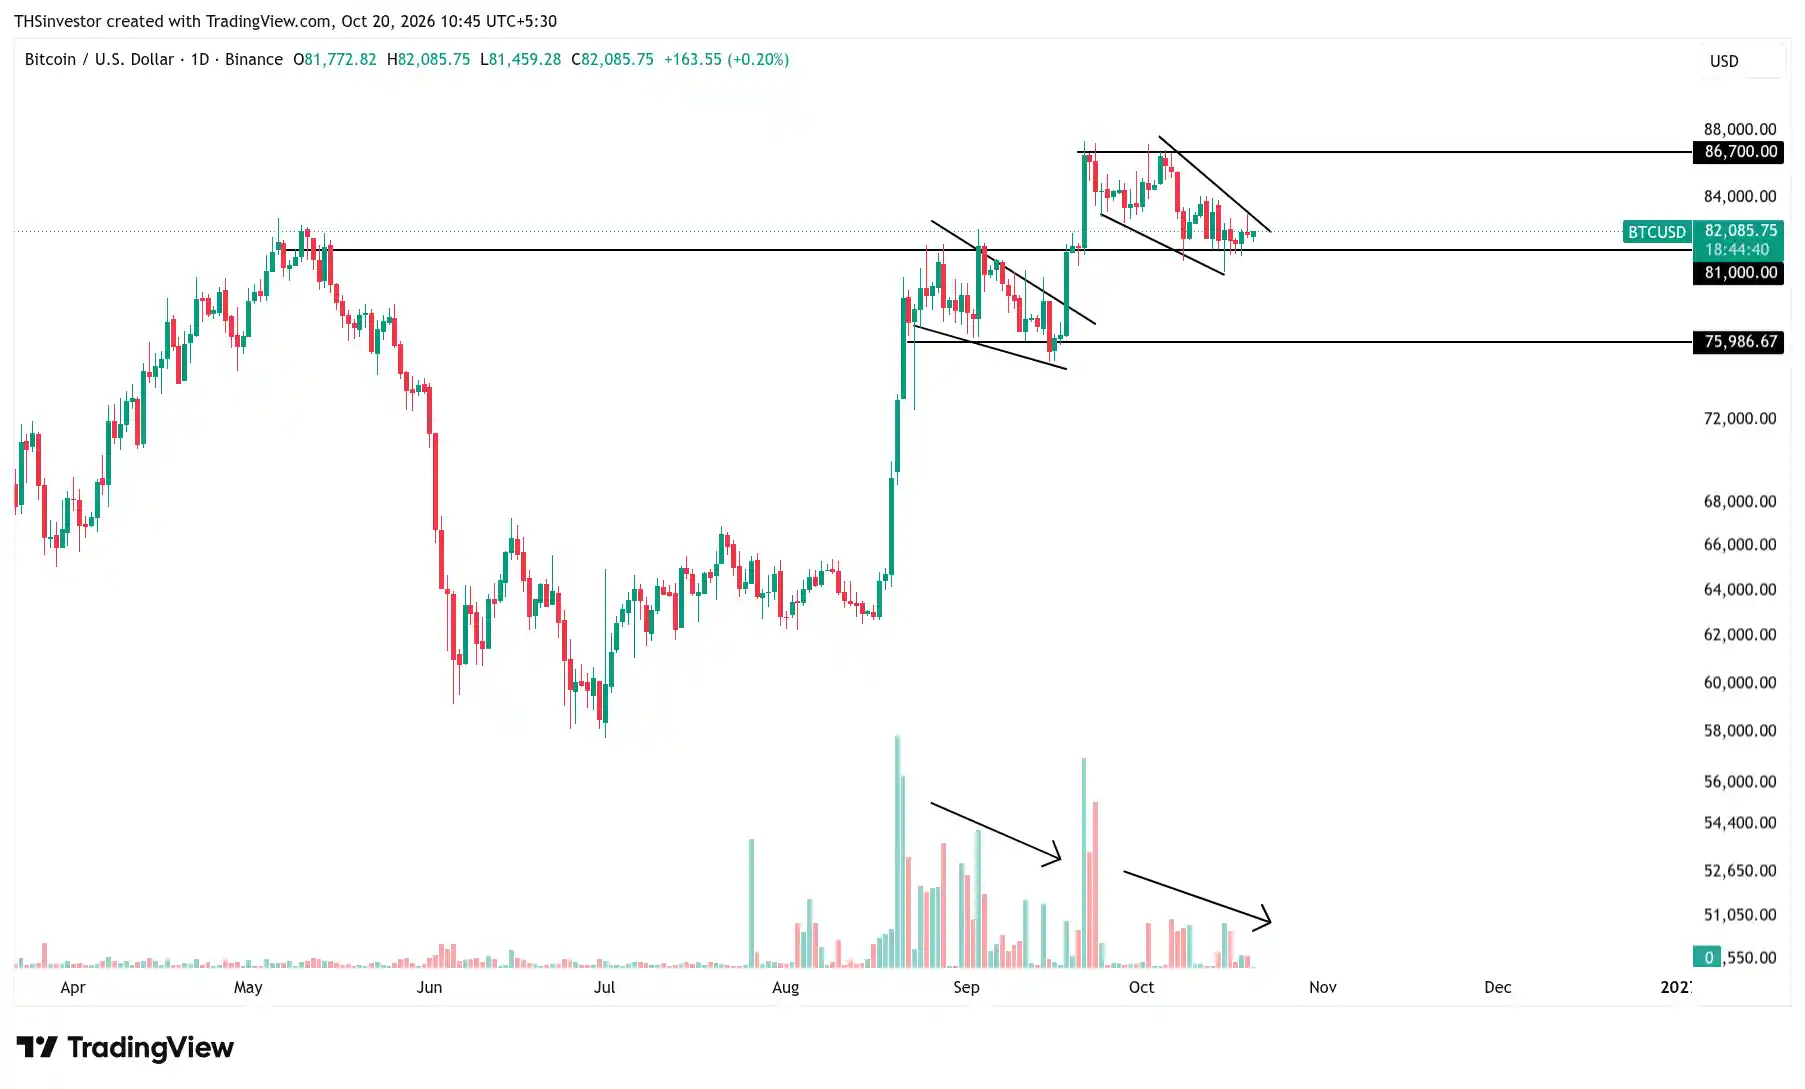
Key Support: If Bitcoin breaks below $80,000, the chances of an upside move will reduce and $76,000 becomes the next level to watch. If that level also fails to hold, we could see another prolonged bearish phase. However, there are no such warning signs as of now.
Key Resistance: On the upside, $94,000-$95,000 is the next major level to watch. Bitcoin needs to show strength before this target comes into play.
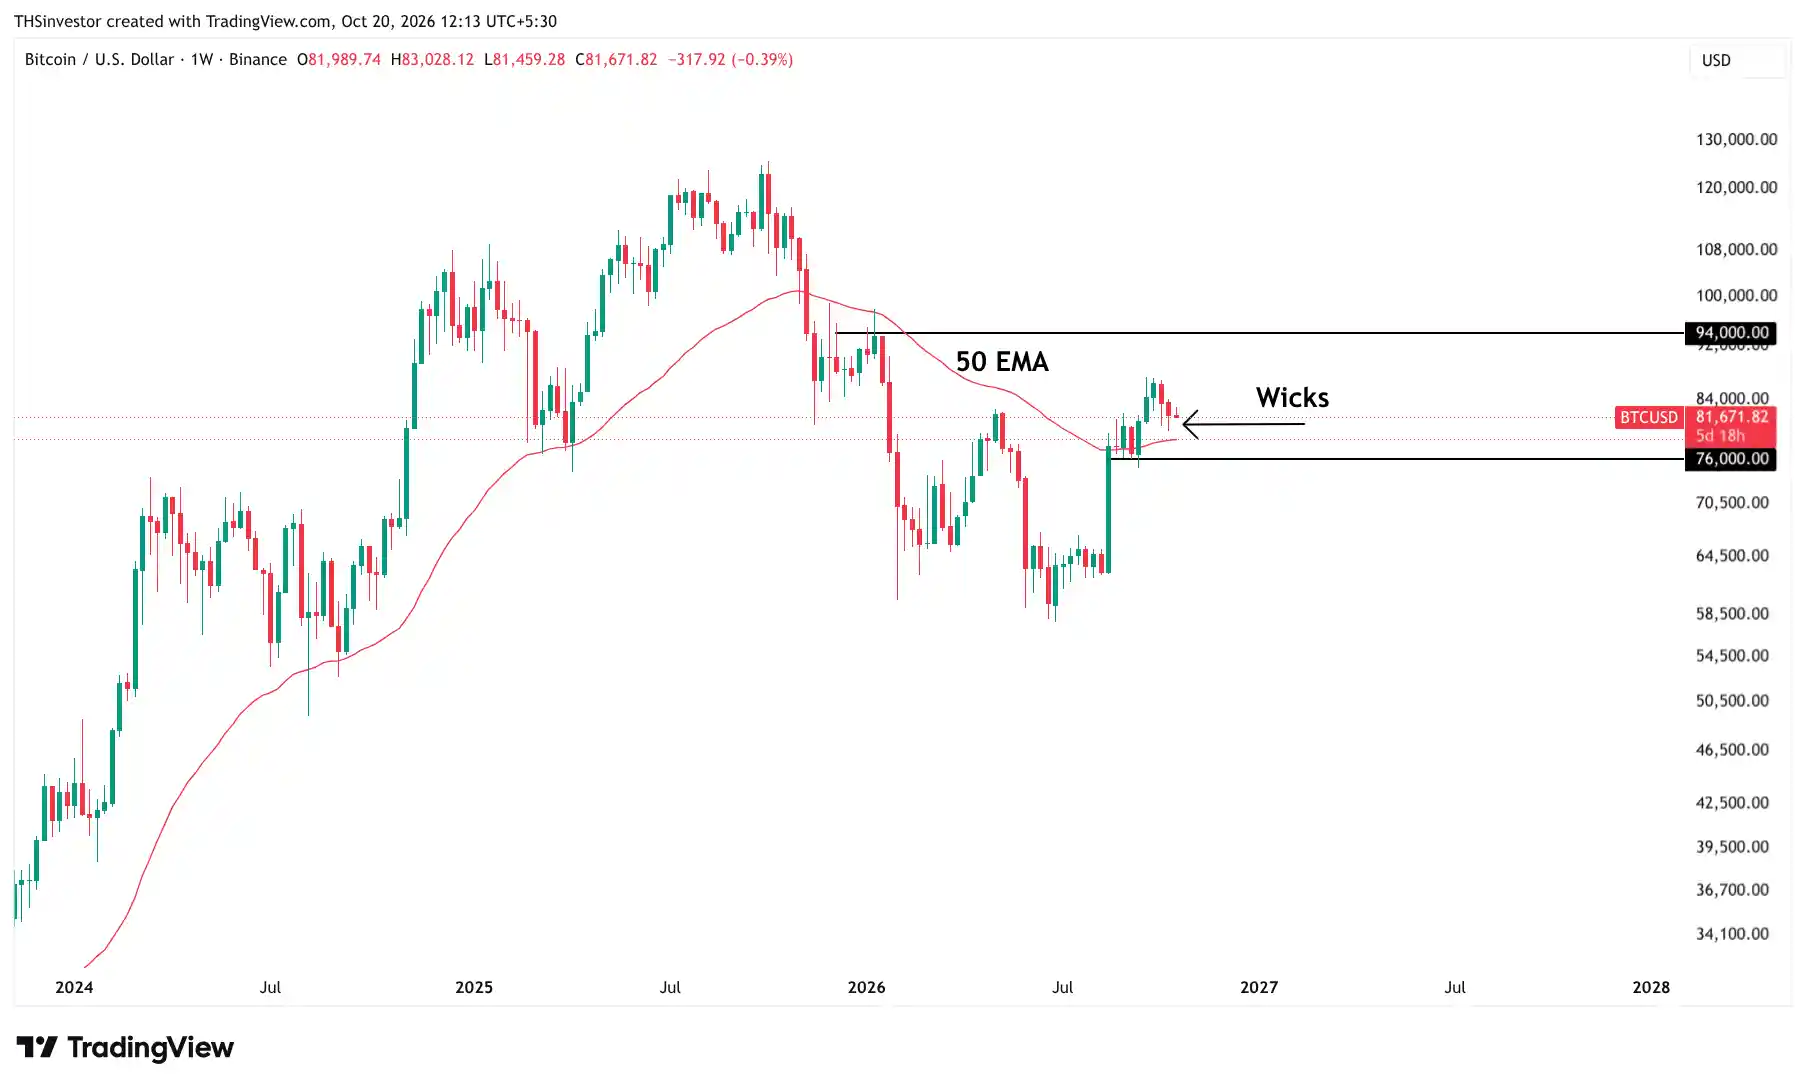
Weekly Trend: The weekly trend remains upward despite two consecutive red candles. Both candles have lower wicks, showing that buyers are still present at lower levels.
50 EMA: The 50 EMA on the weekly chart is an important level that Bitcoin has respected throughout its history. As consolidation continues, the 50 EMA is approaching $80,000, making this an important support zone.
Verdict: Bitcoin is consolidating around support and we need to wait for confirmation before taking positions.
Bitcoin Analysis for Next Week: Most Likely, Bull and Bear Cases
Bitcoin is currently range-bound. The market is waiting for a major move, either up or down. Instead of predicting the direction, wait for a big green or red candle to confirm the next move.
Bull case: Bond yields cool and tech earnings improve risk appetite. Bitcoin breaks above the resistance level discussed in the technical section and closes above it. Sustained ETF inflows would strengthen the breakout, while Ether and major altcoins could recover.
Bear case: Bond yields rise, oil prices spike or rate hike fears return. Bitcoin breaks below the support level discussed in the technical section and closes below it. ETF outflows could increase, while altcoins fall faster as leveraged positions unwind.