

Bitcoin Analysis for Next Week starts with a simple message: institutions sold, but buyers defended the lows. Bitcoin closed the week at $83,691.15, down 3.27%. The main reason was institutional de-risking. US spot ETFs saw net outflows of $678.9M while a firm dollar and higher yields kept liquidity tight.
Our market view is defensive and range bound with a bullish technical lean. Big players cut exposure but buyers stepped in when Bitcoin dipped.
Key Takeaways:
- Spot ETFs saw net outflows of $678.9M showing that institutions cut exposure.
- A firm dollar and a 10-year yield above 4.10% kept liquidity tight.
- Ethereum fell more than twice as much as Bitcoin, showing that traders cut risk more aggressively in Ethereum.
- Stablecoin supply shrank, so less money was available to absorb the selling.
Bitcoin Analysis for Next Week: Bitcoin Falls 3.27%
Bitcoin opened the week at $86,516.30 and peaked at $86,978.45 on Monday. It then fell through Thursday and hit a weekly low of $80,365.12 on Friday before recovering to close at $83,691.15.
The main reason was institutional reducing their risks. Spot ETF selling peaked midweek, while a firm dollar and higher yields left little fresh liquidity to absorb the selling. As a result, every bounce faced selling pressure.
For Bitcoin Analysis for Next Week, this matters because funds were cutting exposure, not because buyers had disappeared. Bitcoin closed higher for three straight days into the weekend, showing that buyers are still stepping in during dips.
Bitcoin Analysis for Next Week: Ethereum After a 7.04% Drop
Ethereum fell 7.04% to $2,534.80, more than double Bitcoin’s 3.27% drop. ETH hit a high of $2,737.20 on Tuesday and a low of $2,407.10 on Friday.
ETH fell much faster than Bitcoin. This shows traders are cutting risk in the higher-beta asset first. Bitcoin dominance at 58.8% also shows that money is favouring Bitcoin over altcoins. For Ethereum Analysis for Next Week, ETH needs Bitcoin to stabilise before it can lead.
Bitcoin Analysis for Next Week: What Drove the Crypto Market This Week
The main reason was tight macro liquidity, which led institutions to sell. When borrowing becomes expensive and the dollar rises, funds cut risk first. Crypto feels the pressure.
Fed futures now price an 85% chance of a 25 bps cut on 28 October. The chances of a 50 bps cut are gone. The 10-year yield moved above 4.10%, the 2-year yield held at 3.96%, and the dollar index reached 102.90, its highest level in several weeks.
Stablecoin supply also fell by $240M. This means no fresh cash entered the market, even though whale wallets kept adding USDT to exchange order books. Data from CoinGecko shows the total crypto market cap falling to around $2.82T.
Crypto remains sensitive to liquidity and interest rates. Watch yields, the dollar and stablecoin supply for the next move.
Bitcoin Analysis for Next Week: Institutions Cutting Exposure
US spot Bitcoin ETFs saw net outflows of $678.9M this week. There were outflows on three of five days, peaking at $484.9M on Wednesday. Tuesday and Friday saw small inflows of $118.8M and $21.1M.
We need several consecutive days of inflows to confirm a real shift. For Bitcoin ETF flow analysis next week, a second straight day of inflows would be the first sign that institutions are returning.
Bitcoin Analysis for Next Week: Top 3 Events
US Court declines Silk Road BTC case review
The decision clears the way for the US Marshals Service to sell 69,370 BTC. No sale has been confirmed, so the next signal is any wallet movement, which would raise supply fears again.
SEC issues new subpoenas to crypto market makers
The probe into unregistered broker activity thinned altcoin liquidity and pushed institutions to cut risk. It shows regulatory pressure lands hardest on altcoins and keeps the altcoin market outlook selective.
Metaplanet buys another 108.8 BTC
The Tokyo listed firm added about ¥1 billion of Bitcoin. Steady corporate buying absorbed part of the selling and helped the weekly close recover from the lows.
Bitcoin Analysis for Next Week: Technical Analysis
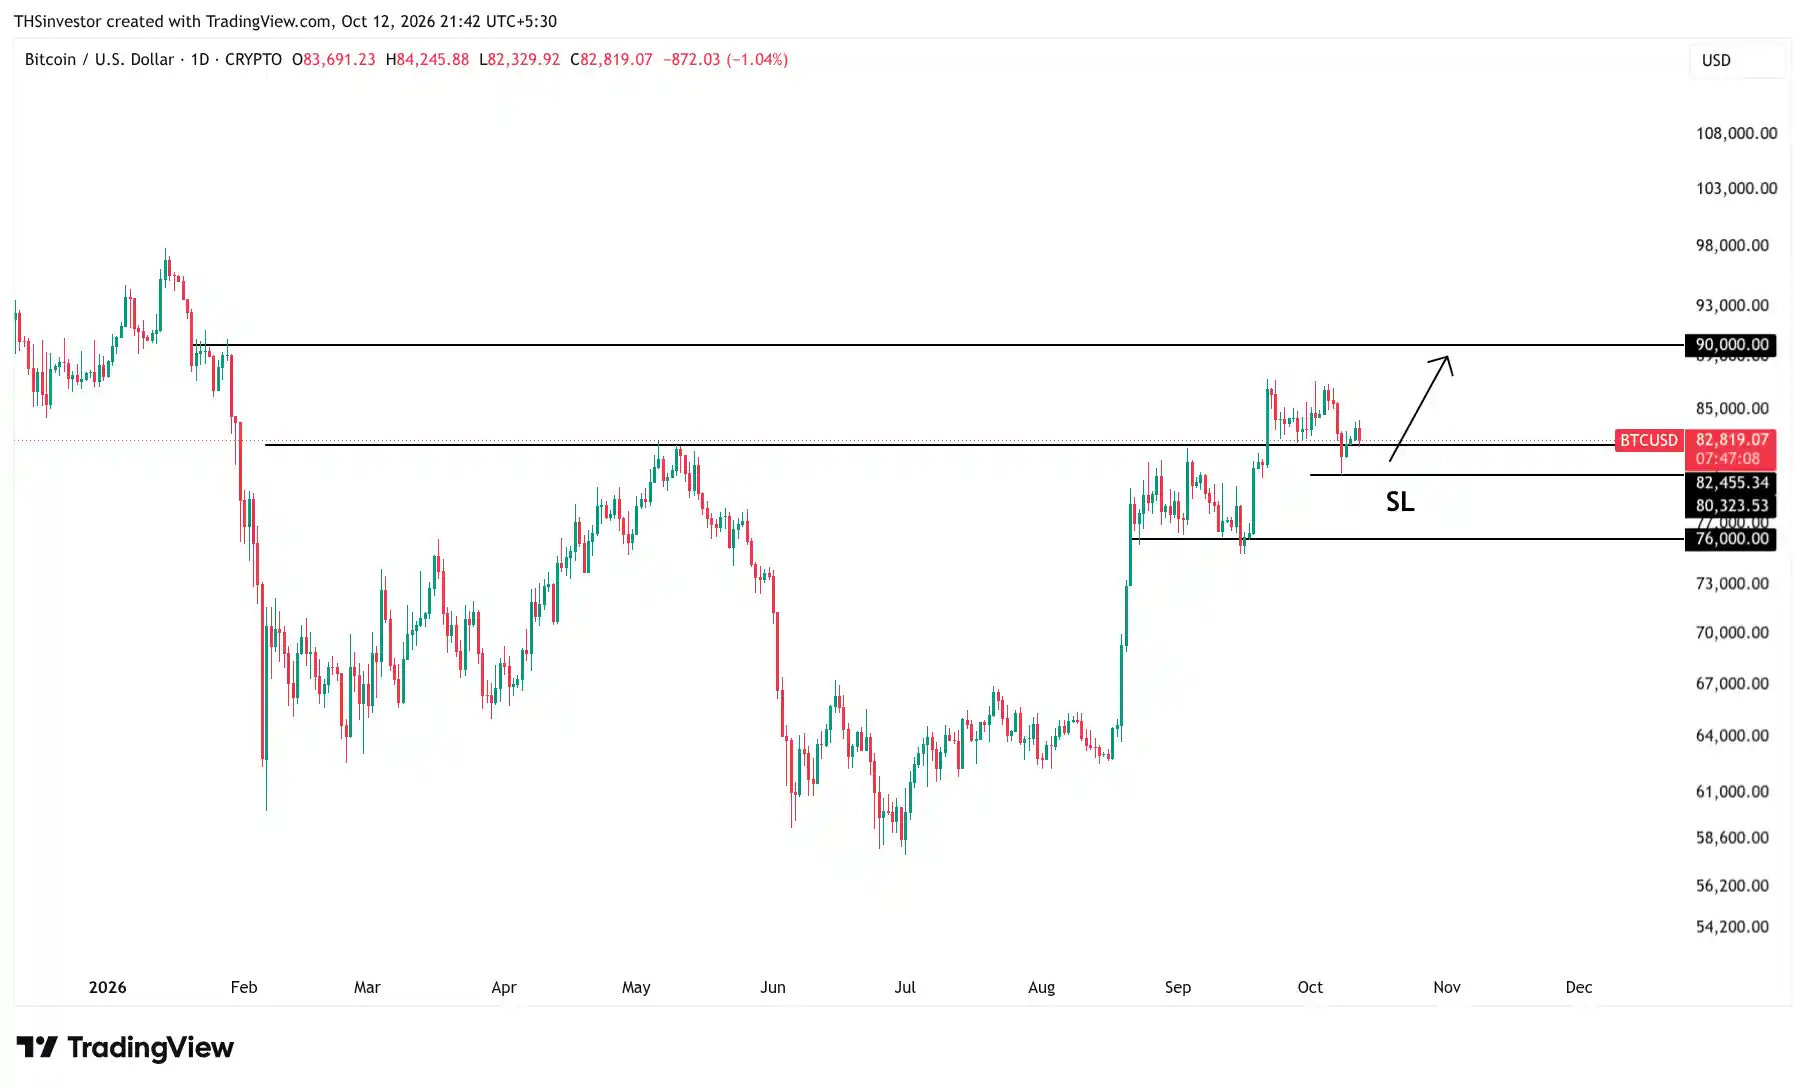
Key Resistance: $90,000 is the next level to watch. Bitcoin first needs to move above the $87,000 range top before $90,000 comes into play.
Key Support: $80,000 is the first support, with $82,000 now back below price. If Bitcoin falls below $80,000, our view remains sideways, with $76,000 as the next level. A break below $76,000 would turn the market bearish, so holding this level is important for Bitcoin’s long-term trend.
Momentum: The candle that made the weekly low has a long lower wick. This shows that buyers stepped in below $82,000 and defended the dip.
Near-Term Setup: The expected sweep has played out, so our next scenario is now in play: a move towards $90,000. Our stop-loss level is clear and sits below the weekly low of $80,365. The plan for Bitcoin Analysis for Next Week is simple: buy dips near support and respect the stop-loss.
Invalidation: A weekly close below $76,000 turns this technical view bearish.
Bitcoin Analysis for Next Week: Bull, Bear Cases and Rangebound
Bitcoin analysis for Next Week, triggers: Fed decision on 28 October, the US 10-year yield, the dollar index, any movement in Silk Road wallets and ETF flows.
Bull Case (45%): ETF inflows return for several days, yields cool and stablecoin supply starts growing again. This could push Bitcoin towards the resistance mentioned in the technical section. Altcoins may follow once Bitcoin moves higher.
Bear Case (25%): Silk Road coins move to exchanges, yields and the dollar rise or ETF outflows continue. A break below the $76,000 would put more pressure on altcoins.
Rangebound (30%): Bitcoin stays within a range, breaks $80,000 and stays above $76,000. ETFs see small inflows and outflows, Ethereum stays behind Bitcoin and altcoins remain selective after the SEC subpoenas.

![Best Cryptocurrencies to Invest [2026]: Top Small-Cap Altcoins](https://thsinvestor.com/wp-content/uploads/2025/11/Best-Cryptocurrencies-smallcap-768x384.webp)