

Bitcoin's rebound failed to hold. It rallied nearly 4% on Wednesday but gave back all the gains on Thursday. It closed the week down 4.55% at $74,774.
Last week, the focus was on exchange trust following the Binance hack. This week, the pressure came from broader market weakness. Bitcoin traded more like a high-beta tech stock with institutions cutting exposure through spot ETFs that hold actual Bitcoin.
Spot Bitcoin ETFs saw $1.28 billion in weekly outflows, their biggest since June. There was no safe-haven buying either. The broader crypto market remained under pressure.
Our technical outlook is also turning weaker. Last week, we warned that a decisive break below support could turn the pullback into a deeper correction. That break has now happened.
Key Takeaways:
- Spot Bitcoin ETFs saw $1.28 billion in outflows. Institutions are reducing exposure rather than buying the dip.
- Bitcoin moved almost in line with the Nasdaq during its worst session.
- Ether fell harder than Bitcoin, showing that traders are cutting riskier positions first.
- Strategy continues to buy Bitcoin.
Bitcoin Analysis for Next Week: Bitcoin Weekly Analysis
Bitcoin opened the week at $78,337.80 and closed at $74,774.20, down 4.55%. The weekly range was $74,002.50 to $81,115.50, a 9.6% swing from low to high.
The week had two very different phases. Monday extended the previous week's selling, with Bitcoin closing near $76,800. Wednesday brought a sharp rebound in equities and Bitcoin rallied nearly 4% to $80,477. But the rally didn't last. It was largely driven by strength in stocks rather than fresh buying in crypto. On Thursday, Bitcoin dropped 5.5% as tech stocks crashed, wiping out the entire rebound.
Friday and Saturday were relatively quiet, with Bitcoin holding near $75,800. Sunday brought another 1.4% decline.
Bitcoin Analysis for Next Week: Ethereum Analysis
Ether fell 6.26%, compared with Bitcoin’s 4.55% decline. The ETH/BTC ratio, which shows how much Bitcoin one Ether can buy, also slipped around 2%. Ether traded between $2,086.77 and $2,445.25 during the week.
Leverage explains the bigger fall. During the weekend sell-off, Ether longs lost $448 million compared with $272 million for Bitcoin. Liquidations are forced closures of leveraged trades. Ether positions were more crowded after Wednesday’s 6.6% rally, so the unwinding hit harder.
The key takeaway is risk appetite. When Ether falls more than Bitcoin, traders are usually cutting higher-risk exposure first. For next week, the takeaway is simple: Ether needs Bitcoin to stabilise before it can recover.
Bitcoin Analysis for Next Week: Tech Rout Drove the Market
The main driver this week was a broader risk-off move across markets. Bitcoin followed equities in both directions. It rallied with Wednesday’s stock rebound and then fell 5.5% on Thursday, almost matching the Nasdaq’s 5.52% decline. When two assets move almost in sync, Bitcoin is trading like a liquidity asset rather than a hedge.
The expected shift of money from AI stocks into Bitcoin never happened. The Philadelphia Semiconductor Index fell 12.25% on Thursday and South Korea’s Kospi was halted on Friday after plunging around 8%. Investors were selling across the board and Bitcoin was also on the list.
Crypto also became an outlet for equity market stress over the weekend. Tokenised Nvidia shares and perpetual futures (contracts with no expiry date) continued trading while stock markets were closed.
The next test is inflation and interest rates. A softer CPI reading on Tuesday could push yields lower and ease pressure on risk assets. The Fed held rates at 3.75% to 4%, but two members wanted a hike. A hotter CPI reading could bring rate hike fears back.
But lower yields alone won't be enough to turn the crypto market around this week. We also need to see fresh demand through ETF flows.
Bitcoin Analysis for Next Week: Bitcoin ETF Flow
Spot Bitcoin ETFs recorded $1.28 billion in outflows this week, the biggest weekly exit since June. This is a clear positioning signal. Institutions reduced exposure in four of the five sessions, with the only inflow coming on Wednesday at $74.6 million.
ETF flows failed to support price at every turn. Wednesday’s nearly 4% rally attracted just $74.6 million, a weak response to such a strong move. On Tuesday, Bitcoin gained but ETFs still saw $115.6 million in outflows. If real demand was coming in, we should have seen it during the rally.
Friday was the biggest warning. Bitcoin was almost flat, yet $411.9 million left the funds. Selling during a calm session looks more like planned de-risking than panic. This is the kind of activity we see during a distribution phase.
Including last week’s $202 million exit, total outflows over two weeks have reached around $1.48 billion. Year-to-date flows are now negative by roughly $914 million. The positive ETF inflow trend that crypto bulls had relied on since August has now stalled.
For next week, we need to see inflows that hold up even on a down day. Weekly fund flows can also be cross-checked through reports.
You can cross-check weekly fund flows in the Farside reports.
Bitcoin Analysis for Next Week: News That Shaped the Crypto Market This Week
Strategy Buys 1,036 BTC as Price Falls Below Its Average Cost
Strategy bought 1,036 BTC for $81.9 million at an average of $79,012, lifting holdings to 850,364 BTC. It is the second weekly purchase in a row, disclosed in a filing with the <a href="https://www.sec.gov/">SEC</a>. Bitcoin closed the week below the firm’s average cost of about $75,456, so its whole position is now under water. The buying was funded by selling MSTR shares, and the firm also repurchased $188.3 million of STRC preferred shares.
Democratic Election Gains Raise Data-Centre Risk for Bitcoin Miners
Investors fear stronger opposition to data-centre construction after the US midterms. That matters because many Bitcoin miners have pivoted to AI computing for steadier revenue. Pressure on that plan removes a valuation support and adds to selling in crypto-linked equities. It also weakens the idea that AI money could rotate into Bitcoin. Policy headlines on data centres are a risk to watch next week.
Over $1 Billion of Longs Wiped Out as Iran Talks Stall
Weekend selling liquidated more than $1 billion of leveraged positions in 24 hours, with about $913 million in longs. The triggers were stalled US-Iran talks, rising oil prices and a controversy around Nvidia’s CEO that the company’s board is now investigating. Long losses show traders had positioned for a bounce after Wednesday. Forced selling clears leverage, but it does not create new buyers. Oil is the macro swing factor, because higher oil keeps rate pressure alive for risk assets.
Bitcoin Analysis for Next Week: Bitcoin Technical Analysis for Next Week
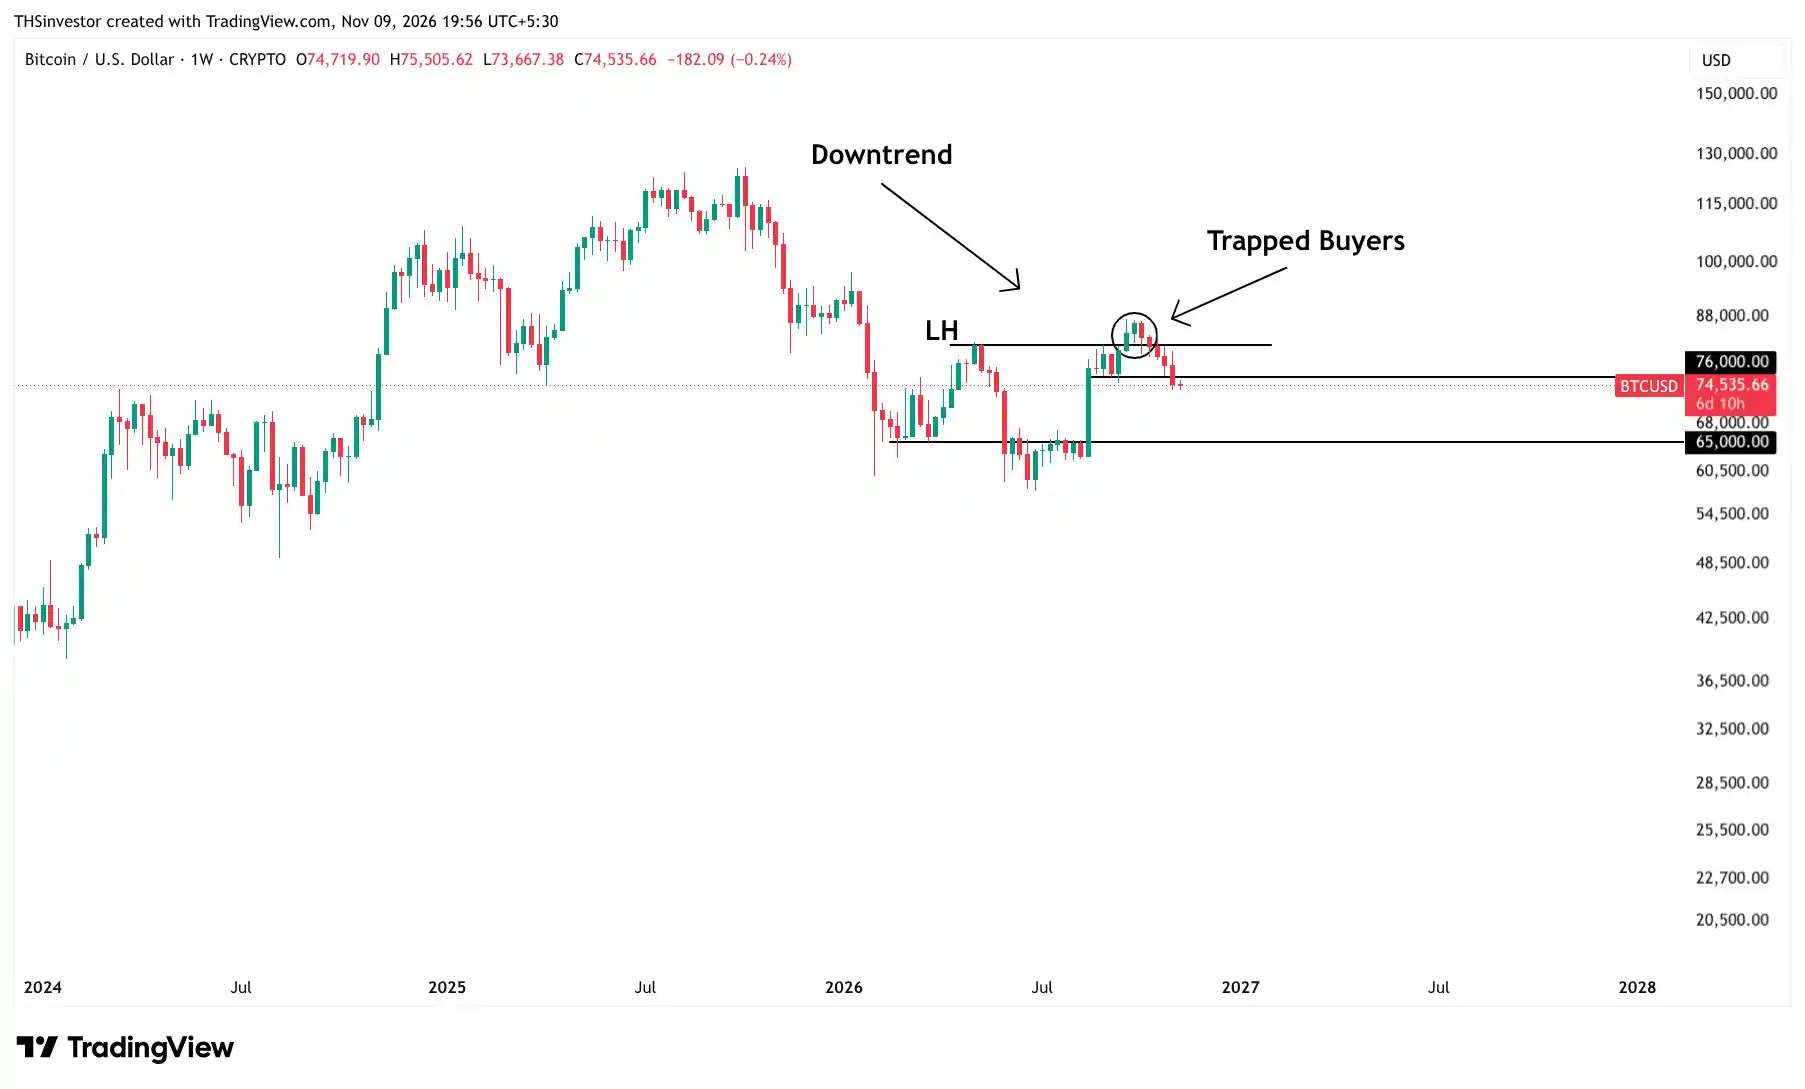
The weekly chart has turned bearish after Bitcoin failed to hold $76,000 and closed around $74,774. The recent high near $87,000 now looks like a pullback within the larger downtrend from $125,000. Bitcoin briefly broke the previous lower high near $83,000 but failed to hold the breakout, trapping buyers.
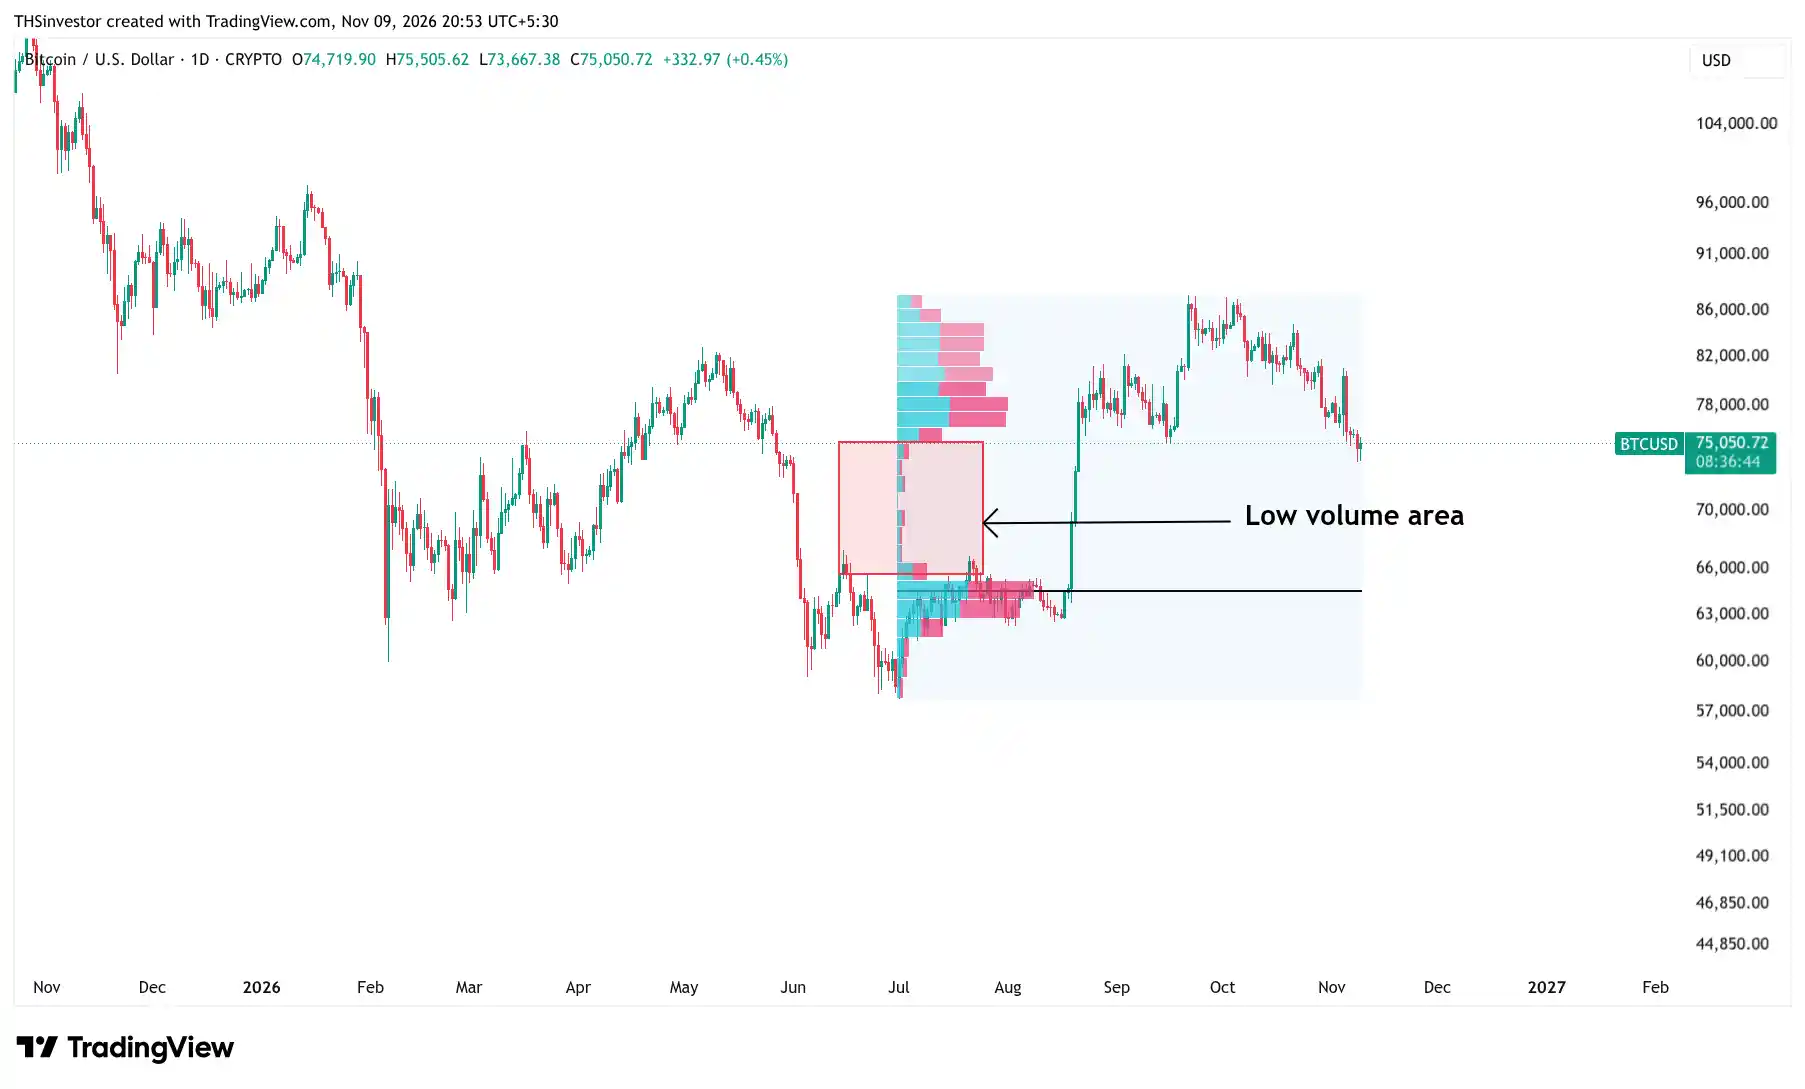
The next major support is around $65,000. There is no significant support between $76,000 and $65,000. This is a low-volume zone where limited trading activity could allow price to fall quickly.
The daily chart also confirms the weakness. Large red candles closing near their lows show strong selling pressure. Bitcoin failed to sustain its recovery towards $80,000 and recently dropped to $73,761 before bouncing. Sellers remain in control.
For now, $76,000 is the key level to reclaim. A sustained move above it would be the first sign of recovery. After that, we want to see Bitcoin form higher highs and eventually break above $83,000 to confirm a daily trend reversal.
Until then, the market remains in a clear downtrend and rallies are likely to face selling pressure. A decisive break below the recent low near $73,700 could accelerate the decline towards $65,000.
Bitcoin Analysis for Next Week: $76,000 Is the Key Level
Bitcoin remains bearish after losing its last major support at $76,000 and closing near $74,774. The next major support is $65,000, with very little trading activity between these levels. The recent high near $87,000 now looks like a pullback within the larger downtrend from $125,000.
This remains a sell-on-rise market.
Institutional demand is weakening. Bitcoin ETFs recorded $1.282 billion in weekly outflows, their biggest withdrawal since June. YTD flows have turned negative by $914 million. Weakness in AI and technology stocks is adding to risk aversion, while more than $1.27 billion in crypto positions were liquidated, mostly bullish bets.
Ethereum fell 6.26% last week to $2,133, while Bitcoin dominance rose to 59.9%. Altcoins are likely to remain under pressure as long as Bitcoin stays weak.
Two important developments are coming next week:
10 November – US CPI: Softer inflation could support risk assets, while hotter inflation may bring more selling pressure.
11 November – MSCI announcement: A possible removal of Strategy from its indexes could trigger share selling and hurt sentiment towards Bitcoin treasury companies.
Strategy continues to accumulate Bitcoin. The company purchased another 1,036 BTC last week, taking its total holdings to 850,364 BTC. However, this buying has not been enough to offset ETF outflows.
A relief rally is possible if selling pressure eases and ETF inflows recover. But any recovery needs confirmation. Bitcoin must reclaim $76,000, start making higher highs and eventually break above $83,000.
Our bearish view remains intact below $76,000. The next major downside target is $65,000.