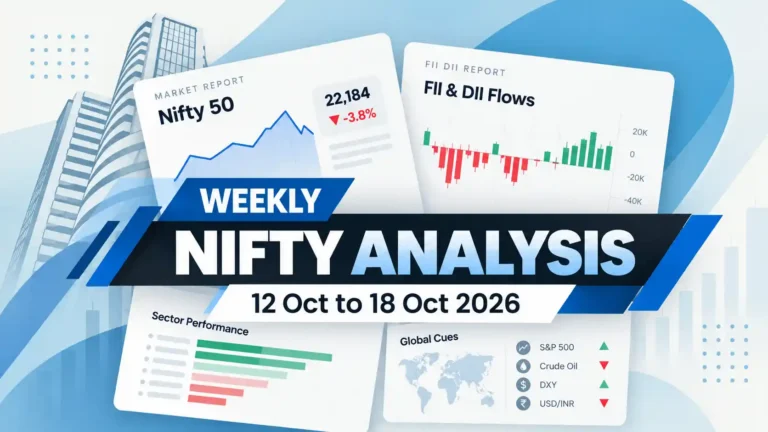

Nifty Analysis for Next Week starts with a mixed message. The daily chart is bullish but the weekly chart remains bearish. Nifty gained 2.00% to close at 23,053.10 and recovered about 83% of last week’s fall. This is a strong rebound but not yet a trend reversal.
Last week we maintained a sell-on-rise view and marked 22,350 as support and 23,200 as resistance. This week Nifty traded between 22,387.35 and 23,118.10, staying within that range. The market bounced but failed to break out.
FIIs turned net buyers and Jio’s 21% listing pop showed that risk appetite is still alive. But Bank Nifty gained only 0.74% and buying remained concentrated. This rally has not earned our trust yet. The next weekly candle will be important in deciding which timeframe takes control.
Key Takeaways:
- Nifty gained 2.00% and recovered about 83% of last week’s fall. It is a rebound, not yet a reversal. The next weekly candle will provide a clearer signal.
- FIIs bought ₹6,304.67 crore after selling last week. However, this is only around 12% of October’s selling and most of the buying came in just two sessions.
- DIIs reduced their buying by around 72%. Domestic institutions are no longer providing the same level of support.
- Last week’s worst-performing sectors led the rebound. This looks more like short covering than fresh buying conviction.
Nifty Analysis for Next Week: Nifty Gains 2%
Nifty opened the week at 22,600 and closed at 23,053.10, gaining 2.00%.
Look at how the gains came in. Monday to Wednesday saw Nifty close at 22,753.20, 22,749.75 and 22,698.85. It was a flat start to the week. Thursday and Friday then added around 354 points, accounting for 78% of the weekly gain.
Three sessions of sideways movement followed by two sessions of strong buying suggest sellers were defending higher levels early in the week but eventually lost control.
Thursday was the first Indian trading session after the Fed held interest rates. Nifty gained 1.05% that day as markets took the decision as relief. This was a relief rally rather than a sign of strong buying conviction.
For Nifty Analysis for Next Week, the first test for bulls is whether Monday brings follow-through buying.
Nifty Analysis for Next Week: Bank Nifty Adds Just 0.74% and Lags Nifty Again
Bank Nifty opened at 54,287 and closed at 54,686.95, gaining 0.74%. The weekly range was 53,626.15 to 55,068.50. It captured just over a third of Nifty’s gain, meaning banks have lagged the broader rebound for the second consecutive week.
Banks are lagging because they need lower interest rates and faster credit growth. Neither is currently on offer. A Fed that is still debating rate hikes keeps global yields elevated. Meanwhile, slower credit growth, as discussed last week, limits the growth potential for banks. Financial Services gained 1.27%, well below Nifty's 2.00% rise.
For Nifty Analysis for Next Week, Bank Nifty remains our confirmation index. A rally that banks do not participate in is still a narrow rally. We want Bank Nifty to break above this week's high of 55,068.50 before trusting the broader recovery.
Nifty Analysis for Next Week: News That Moved the Market
Fed Holds at 3.75% to 4% in a 10-2 Vote as Two Members Wanted a Hike
The Fed kept interest rates unchanged, as expected. It cited strong economic activity, consumer spending and business investment. However, inflation remains the main concern. Chair Warsh said policymakers are ready to act but gave no clear signal on the December decision. The two dissenting members wanted a rate hike rather than a cut. This shows the debate within the Fed is shifting towards whether rates need to go even higher. For India, this keeps the dollar and US yields firm and makes this week's FII buying less convincing. Watch US yields, the dollar and the next Fed decision on 9 December. If FPIs continue buying Indian equities even while US rates remain high, that would signal a genuine shift in foreign investor sentiment.
Gold Falls 3.3% and Silver 5.9% as Global Investors Rush to Cash
Gold fell 3.3% to $3,885.70 an ounce while silver dropped 5.9% to below $50 on Friday. For the week, gold lost 2.7% and silver fell 8.6%. Rising crude prices amid Middle East tensions fuelled inflation fears and expectations of higher US rates. At the same time, a tech selloff, margin calls and a reported crypto hack pushed investors towards cash. When even gold gets sold, it suggests investors are dumping assets to raise cash. This is forced selling rather than normal risk-off behaviour. For India, cheaper gold could help reduce the import bill. But Nifty closed higher despite the global selloff. Monday's session will show whether Indian markets were genuinely resilient or simply reacting late to global pressure.
Jio Platforms Lists 21% Higher and Becomes India’s Second-Largest Listed Company
Jio raised $3.2 billion in India's largest-ever IPO, attracting over $77 billion in bids. The issue was subscribed 22.19 times with more than 13.8 million applications. Shares listed at ₹1,358 against the issue price of ₹1,119, a gain of 21%, giving the company a market value of ₹12.5 lakh crore ($131.9 billion). Last week we asked whether a strong debut would show that risk appetite was still alive. It did. Most of the bidding money was returned through refunds, which may have supported this week's market bounce. But there is another side to watch. Funds that need to hold Jio shares may sell other large-cap stocks to make room.
Nifty Analysis for Next Week: FIIs Buy ₹6,305 Crore
FIIs bought ₹6,304.67 crore in the cash market this week, reversing last week's ₹2,697.37 crore of selling. But FPIs had sold ₹52,353 crore through 22 October. This week's buying covers only 12% of that amount. One good week does not undo a month of selling.
The buying was concentrated on Tuesday (₹4,240.39 crore) and Friday (₹3,598.54 crore). The other three sessions saw net selling of ₹1,534.26 crore. This looks more like short-term trading than sustained accumulation.
Tuesday is a warning sign. Despite heavy FII buying Nifty remained flat while DIIs sold ₹1,250.03 crore. This suggests strong supply at higher levels.
Friday's buying also needs context. Global investors were selling gold, silver and tech stocks for cash. FIIs bought ₹3,598.54 crore in India, which looks more like month-end repositioning than a fresh long-term bet. Their heavy short positions in index futures also mean cash buying could be a hedge rather than genuine bullish positioning.
The reasons behind FII selling remain. Rising oil prices pressure India's import bill and the rupee while high US yields make dollar assets more attractive.
DIIs bought ₹3,109.79 crore, down 72% from last week's ₹10,942.19 crore. They also sold on Tuesday and Friday when FIIs were buying. Domestic funds are not aggressively chasing this rebound.
However, September's record SIP inflows of ₹32,490 crore continue to provide domestic funds with a steady source of buying power.
For Nifty Analysis for Next Week, the key question is whether FIIs continue buying on days when the market actually rises. If they turn sellers again on Monday this week's activity looks more like short covering than a genuine reversal.
Nifty Analysis for Next Week: Last Week’s Losers Led the Bounce
Media (+4.34%), Capital Markets (+4.01%) and Realty (+3.77%) led the market. Capital Markets and Realty were among last week's worst performers. When beaten-down sectors lead a bounce, it usually points to short covering and bargain hunting rather than fresh buying conviction.
The recovery is still incomplete. Capital Markets remains about 3% below its level from two weeks ago. Defence gained just 1.67% after falling 6.91% and is still down around 5%. Sellers are still winning in Defence.
IT gained 1.91%, making it the only major sector to remain positive across both weeks. It has been the steadiest sector but global tech selling on Friday makes it vulnerable.
Oil & Gas was the only sector to close in the red at -0.74%, following last week's 2.11% decline. Two consecutive weekly losses suggest crude prices are still pressuring margins.
Financial Services and Energy both gained 1.27%, trailing Nifty's 2.00% rise. Their weak performance matters because banks and energy carry significant weight in the index.
Friday's market breadth was also weak. Only 109 stocks advanced against 387 declines, a ratio of 0.28x. That is better than last week's 0.09x but still means 3.5 stocks fell for every one that rose on a day Nifty gained 0.51%.
For Nifty Analysis for Next Week, we need to see sector leaders hold their gains while laggards catch up. So far only IT has shown consistency. The broader recovery still needs confirmation.
Nifty Analysis for Next Week: Nifty Option Chain Analysis
Nifty option chain analysis for next week starts with a sharp jump in PCR to 1.59 from 0.74 last week. Put writers are now more active, suggesting a shift from selling the upside to defending lower levels.
The highest Put OI is at 23,000 and the highest Call OI is at 23,500, creating a 500-point range. Nifty closed at 23,053.10, just 53 points above the put wall. This makes 23,000 an important support level but also a potential trap door.
If Nifty breaks below 23,000, put writers may hedge by selling futures. That could accelerate the fall and increase volatility. A high PCR also signals a crowded bullish trade, which can unwind quickly if support breaks.
Max Pain is also at 23,000. However, monthly expiry is still three weeks away on 23 November, so its influence is limited for now.
India VIX fell around 9% to 15.30 from 16.86 last week. Falling volatility alongside a rising Nifty is positive. But VIX near 15 still suggests enough uncertainty to justify protection.
Bank Nifty has a weaker setup. Its PCR is 0.95, showing less confidence among option writers. Max Pain is 55,500, around 813 points above the close. The highest Put OI at 54,000 is 687 points below while the highest Call OI at 57,000 is roughly 2,300 points above.
In short, Nifty option writers are defending 23,000 while Bank Nifty positioning remains less convincing. A break below Nifty's put wall could quickly change the picture.
You can track live OI changes on the NSE India website.
Nifty Analysis for Next Week: Nifty Technical Analysis
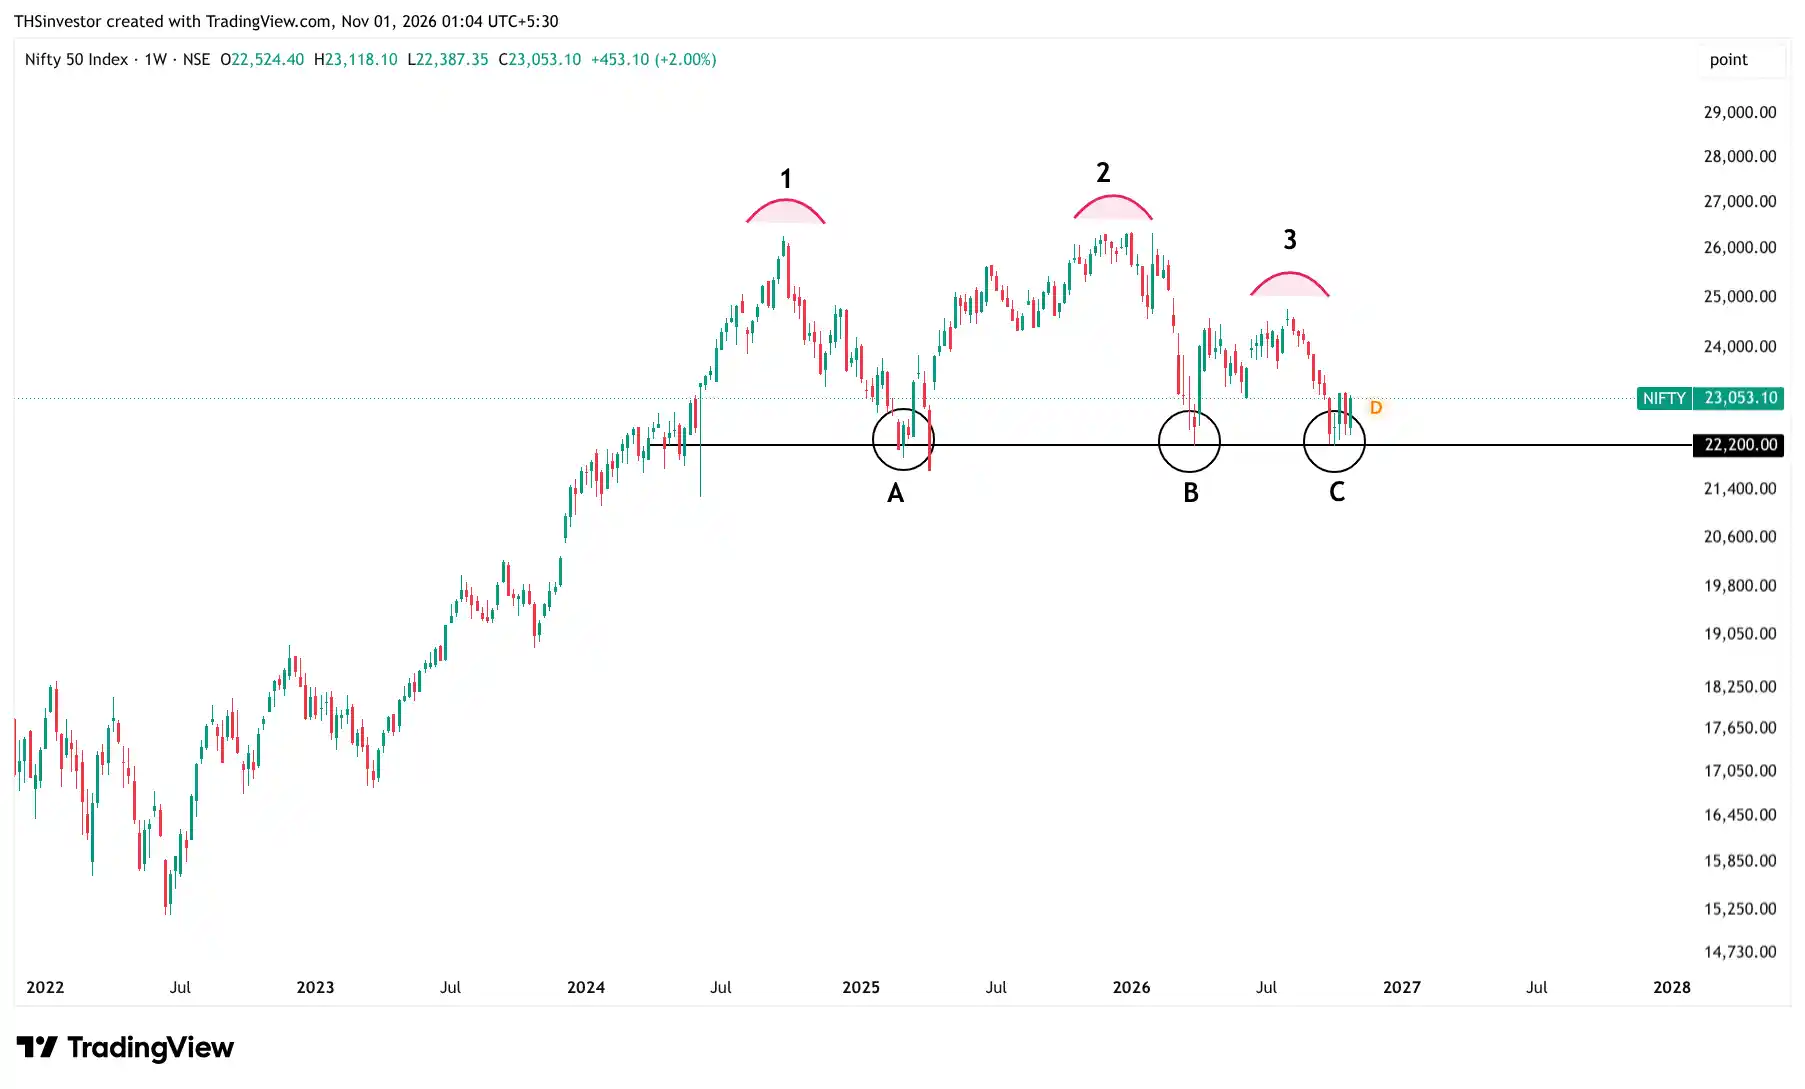
The key weekly support is 22,200. Look at the three bottoms marked A, B and C. At A and B, Nifty bounced quickly from support. At C, which is the current level, price is spending much more time near 22,200. This is a warning sign. The longer price stays near support the more likely it is that buying pressure will weaken. The 22,000 zone remains the final line of defence from our earlier analysis.
There is some positive price action too. Nifty has printed two strong green weekly candles in the last three weeks. But the red candle in between erased the first rally. This week's green candle needs confirmation. We want a strong weekly close above 23,200.
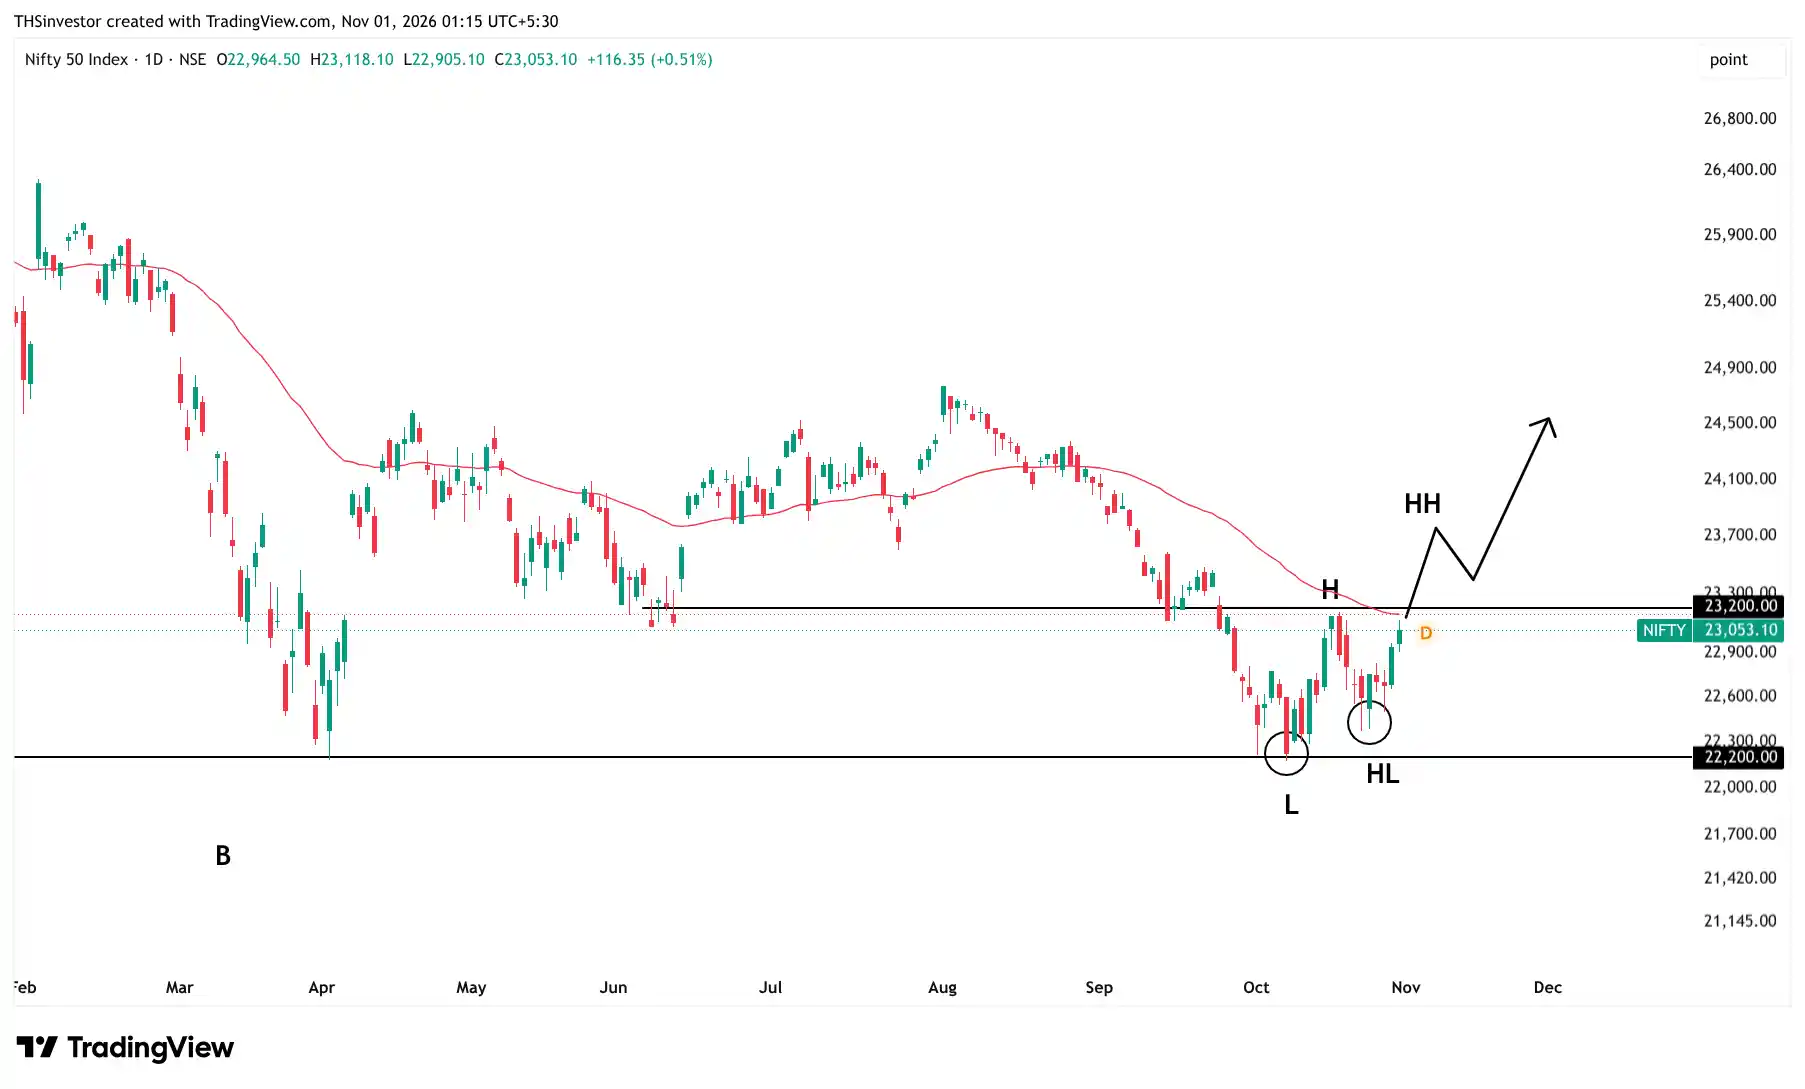
The daily chart looks more optimistic. Nifty has formed higher lows and now needs to make a higher high with a daily close above 23,200.
The 50-day EMA also sits around 23,200. This is the same zone where last week's recovery attempt failed. That makes 23,200 the key decision point on both timeframes.
The next resistance is 23,500. Nifty has already closed above the 22,800-22,850 zone, where the 20-day EMA sits and which capped the recovery last week. Early momentum is positive but the market needs follow-through before the weekly trend can turn bullish.
Our Nifty Analysis for Next Week is straightforward. The daily chart is bullish but the weekly chart remains bearish. The next weekly candle could decide which trend takes control.
Our bias is to trade the daily bounce carefully. Do not call it a trend reversal until Nifty delivers a strong weekly close above 23,200. A daily close above this level would confirm a higher high while a strong weekly close would change the broader trend.
The setup weakens if Nifty breaks below 22,200. That would bring the 22,000 support zone back into focus.
Nifty Analysis for Next Week: Trade the Bounce, Respect the Weekly Trend
Our view for Nifty Analysis for Next Week is cautiously positive in the short term but bearish in the bigger picture. The daily chart is bullish while the weekly chart remains weak. The most likely path is a gradual move towards the resistance zone covered in the technical section with sellers waiting there.
Why a slow grind and not a sharp rally? FIIs bought on only two days, DIIs cut their buying by around 72% and Friday's market breadth was weak at 109 advances against 387 declines. On the positive side, falling VIX and put writers defending support provide a base for the bounce. Together, these signals suggest a gradual recovery rather than a strong rally.
Realty, Capital Markets and Media led the rebound but these high-beta sectors can also fall quickly if resistance holds. IT is more stable but remains exposed to global tech weakness. Banks need to join the rally or the recovery will remain narrow. Meanwhile, September's SIP inflows of ₹32,490 crore continue to provide domestic market support.
Watch Monday's opening closely. Gold and silver crashed on Friday while global margin calls hit tech stocks and crypto. Nifty managed to close higher despite the pressure. Any spillover could appear on Monday. A gap-down opening would be an early warning that the rebound is fragile.
What could turn this bounce into a trend reversal?
Crude oil and foreign flows matter most. Brent falling towards $85–$90 a barrel could ease inflation, support the rupee and encourage FPIs to return after selling ₹52,353 crore through 22 October.
Other supportive factors include cooling inflation, stable interest rates and lower food and energy prices. Better earnings and margins would also help make the recovery sustainable.
Two longer-term triggers are an India-US trade deal that could benefit exporters and continued government spending on infrastructure, defence, railways and power. These are not immediate trading triggers but could support the next bull phase.
What could go wrong?
The bounce could fail and the weekly downtrend could resume. FII buying remains concentrated, DIIs are trimming positions, market breadth is weak and crude prices are still rising. The Fed is also debating rate hikes.
If Nifty faces rejection at the resistance zone and FIIs turn sellers again, the index could move back towards weekly support. That would also bring the margin pressure seen last week back into focus.
A break below the support identified in the technical section, combined with renewed FII selling, would confirm the bearish scenario. On the other hand, a strong weekly close above the marked resistance would confirm a broader trend improvement.
That is our Nifty view for next week: trade the daily bounce carefully and let the weekly candle tell you when the bigger trend has changed.
Key Events to Watch Next Week
| Event | Date | Forecast | Previous |
|---|---|---|---|
| HSBC Manufacturing PMI (Oct Final) | Early Nov | 54.9 | 55.1 |
| HSBC Services PMI (Oct Final) | Early Nov | 56.2 | 55.2 |
| HSBC Composite PMI (Oct Final) | Early Nov | 56.7 | 55.9 |
IPO Tracker This Week
| Company | M.Cap (Cr) | P/E | ROCE | Subscription |
|---|---|---|---|---|
| Bombay Coated & Special Steels | ₹N/A | N/A | N/A | 3.98xx |
| Antala Industries | ₹N/A | N/A | N/A | N/Ax |
| Maxwell Engineering Solutions | ₹216.43 | N/A | N/A | 4.67xx |
| Vectras Enprocon | ₹200.09 | 10.99 | N/A | 1.20xx |
| HGS (India) | ₹130.30 | 9.76 | N/A | 1.16xx |
| Johnsoncab Electricals | ₹N/A | 15.76 | 39.68 | 1.14xx |