
Bitcoin Analysis for Next Week starts with a close call. Bitcoin closed at $80,121.30, just $121 above the $80,000 mark, after falling 5.6% from Wednesday’s high. The bigger trend remains upward but the short-term picture is weak. Tech stocks are under pressure, ETF flows are inconsistent and altcoins are falling harder. We remain cautious and favour selling on rises.
The Fed’s decision on Wednesday, 28 October, is the next major test for risk appetite. This Bitcoin Analysis for Next Week looks at who is buying, who is selling, where Ethereum stands and what could change our view.
Key takeaways:
1. Bitcoin fell 2.42% and closed near the weekly low. Short term, it is sell on rise till $76,000. Weekly trend is still bullish.
2. ETFs attracted $1.07 billion over three days then saw $773.5 million in outflows over two days. This is not consistent buying.
3. Bitcoin dominance at 60.10% shows money moving towards Bitcoin and away from altcoins.
4. The Fed decision on 28 October is the next major test for risk appetite.
Bitcoin Analysis for Next Week: Bitcoin Overview
Bitcoin opened the week at $82,109.10 and climbed to $84,863.20 on Wednesday. The 3.4% rally was completely erased by sellers. Bitcoin closed at $80,121.30, down 2.42% for the week and 5.6% from its high.
Tuesday and Wednesday looked strong. Bitcoin closed at $83,012.40 and then $84,078.10. Dip buyers had reason to feel confident. Then Thursday hit. Bitcoin fell 3.2% in a single session to close at $81,409.30. A rally that reverses this quickly shows weak demand.
The trigger was not specific to crypto. Concerns about AI spending hit tech stocks and Bitcoin fell alongside them. What matters is how the week ended. Bitcoin recorded four consecutive lower closes from Wednesday onward.
The weekly low of $79,277.70 came on Saturday. Sunday’s close was less than $850 above it. Bitcoin finished near the bottom of its weekly range without a meaningful bounce. This points to continued selling pressure rather than strong accumulation.
Bitcoin Analysis for Next Week: Ethereum Overview
Ether opened at $2,408.74 and climbed to $2,522.84 on Wednesday before closing at $2,327. It lost 3.35% for the week against Bitcoin’s 2.42% decline. When ETH falls faster than BTC traders are cutting risk and moving towards the larger asset.
ETH dropped 9.6% from its weekly high to Saturday’s low of $2,280.55. Anyone who bought near Wednesday’s high is now sitting on losses. These trapped buyers can become sellers on every bounce.
Ether is a high-beta asset, meaning it tends to move more sharply than Bitcoin in both directions. That becomes a problem in a falling market. Our Ethereum analysis for next week favours selling into bounces rather than buying them till Bitcoin shows strength.
Bitcoin Analysis for Next Week: AI Fears and the Fed meeting
The main driver this week was risk appetite rather than Bitcoin-specific news. Mixed earnings from Tesla and Meta revived concerns about AI spending. Nasdaq 100 futures fell and Asian stocks tumbled. Bitcoin followed the same trend and fell as much as 2.9% below $82,000.
Bitcoin still trades more like a tech stock than digital gold. When AI stocks come under pressure crypto gets sold too. Anyone expecting Bitcoin to shield them from stock market stress may be too early. The crypto market is now waiting for its next catalyst: the Fed. The rate decision is due on Wednesday, 28 October.
Bitcoin Analysis for Next Week: Bitcoin ETF Flow Analysis
Bitcoin ETFs recorded net inflows of $301.2 million for the week. That looks positive but the underlying data tells a different story.
Monday to Wednesday brought in $1,074.7 million. Then Thursday and Friday saw $773.5 million in outflows. Thursday alone recorded $635.6 million in withdrawals. Around 72% of the early-week inflows were reversed in just two days.
This suggests buyers entered near the highs and pulled out at the first sign of weakness. Money that came in around $82,000-$84,000 is now facing losses and could exit on any bounce. That makes it a potential source of selling pressure rather than support.
Bitcoin ETF flow analysis for next week comes down to one test. We need several consecutive days of inflows before treating them as evidence of sustained demand. You can cross-check weekly fund flows on the Farside.
Bitcoin Analysis for Next Week: News That Moved the Market
JPMorgan Forecasts 10% Annual Bitcoin Returns Over the Next Decade
JPMorgan Asset Management expects Bitcoin to return 10% annually over the next 10 years. Its bear case is -9.7% and its bull case is 17%. For comparison it expects US large caps to return 7.5%, bonds 5.6% to 6.6% and gold 5.5%. This is the first time the bank has published a long-term return range for Bitcoin.
Solana Activates Alpenglow Upgrade Targeting 150ms Finality
Solana activated Alpenglow, its biggest overhaul since 2020. The upgrade aims to cut transaction finality from several seconds to around 150 milliseconds. This could make exchange deposits and stablecoin payments faster.
HSBC Launches RedCoin Stablecoin for 3.3 Million PayMe Users
HSBC launched RedCoin (RCHKD), a Hong Kong dollar stablecoin, on its PayMe app. More than 3.3 million users can activate wallets and pay at over 100,000 merchants. A major bank bringing stablecoins into everyday payments is a long-term positive for crypto adoption. However, it does not change Bitcoin’s short-term view.
Bitcoin Analysis for Next Week: Technical Analysis
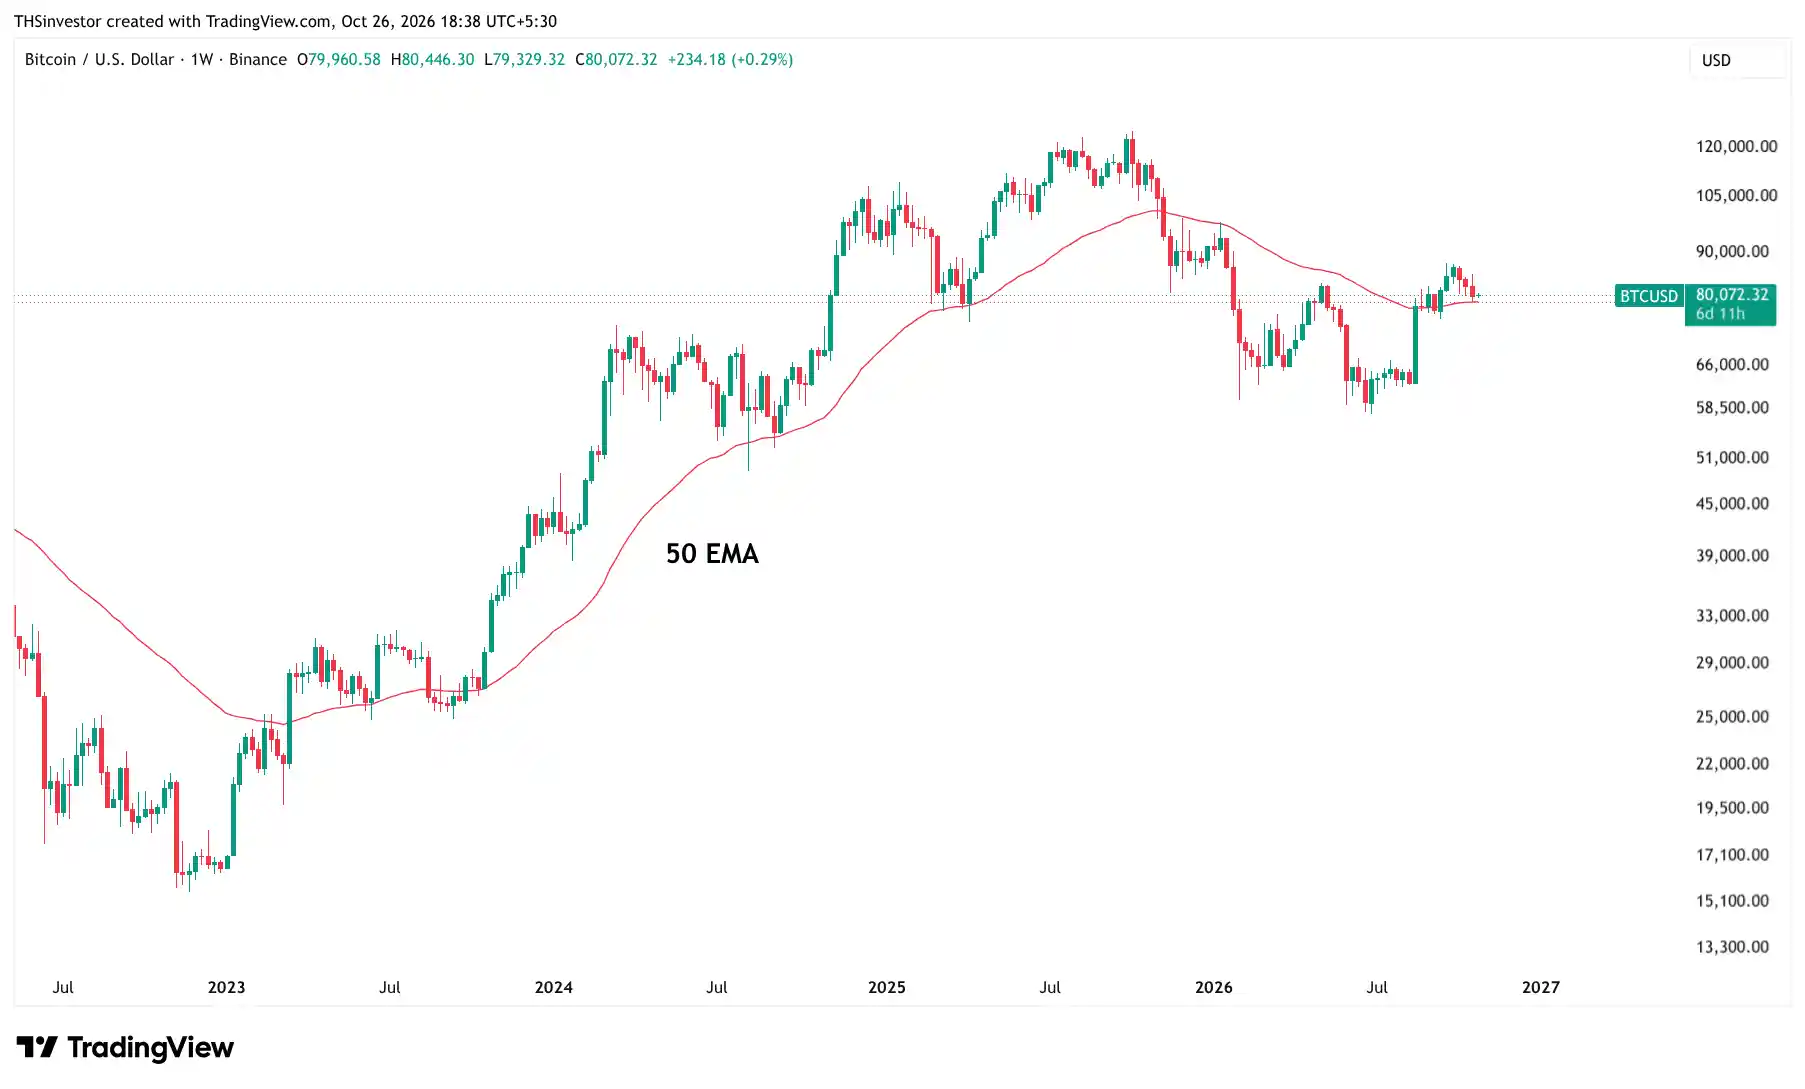
We have seen three consecutive red weekly candles but they are small and volume is weak. There is no major concern yet. If Bitcoin breaks below $80,000 on the weekly chart we expect a gradual move towards $76,000. The real trouble starts only if that support also breaks.
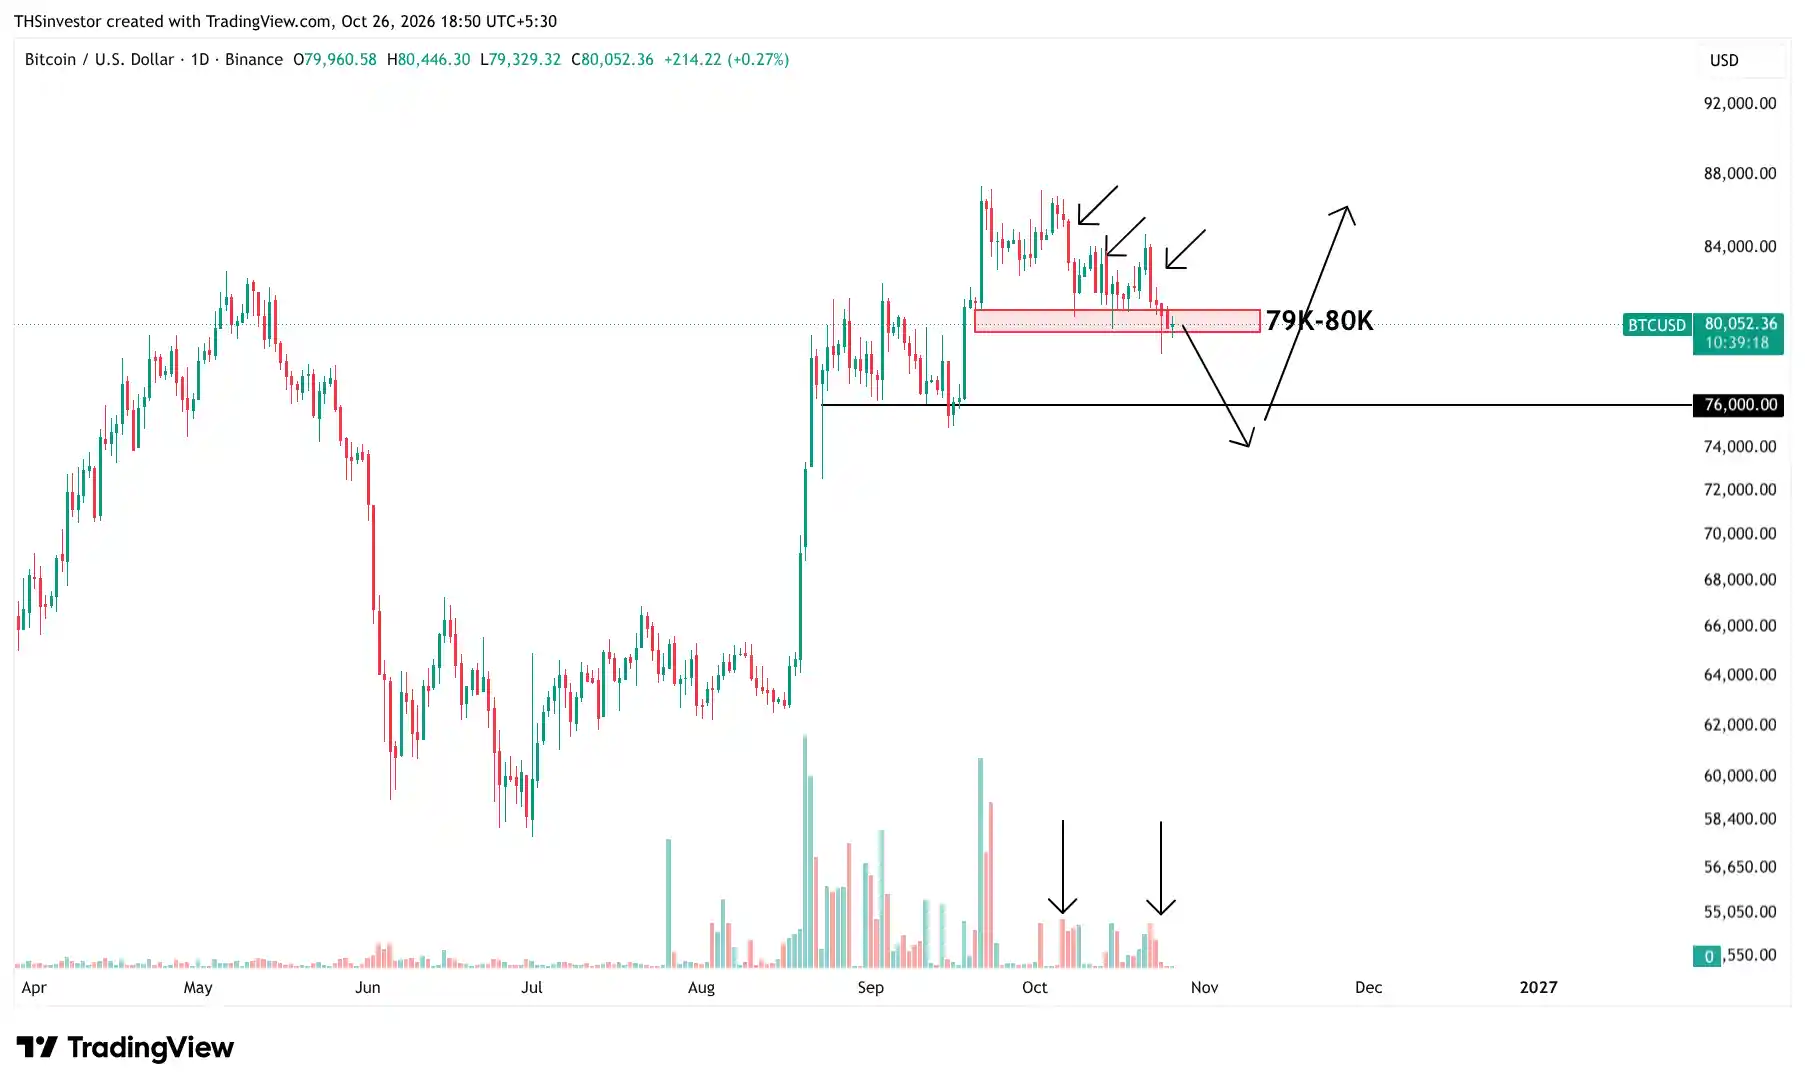
The daily chart tells a weaker story. Price has already broken below $80,000 on the daily timeframe and is now hovering between $79,000 and $80,000. Several daily candles have long lower wicks in this zone. These show that price dipped lower but buyers stepped in and pushed it back up. In other words, buyers are absorbing some of the selling pressure.
But repeated tests of the same support zone are bad for bulls. The pool of buy orders can weaken with each test and $80,000 looks increasingly vulnerable. The daily chart also shows strong red candles on higher volume than the green candles. This tells us sellers are currently more aggressive.
This is the core of our Bitcoin Analysis for Next Week. We expect a test of $76,000 and the market's reaction there will be critical. A break below that level could lead to further downside. The upside resistance for Bitcoin is $84,000 where this week's rally stalled. For Ethereum support is at $2,300 and resistance is at $2,550.
Our bias is to sell on rise. Avoid long trades until a strong green daily candle closes above $80,000. Short trades can be considered if the setup supports a move towards $76,000. A strong daily close above $80,000 would weaken our short-term bearish view. A decisive break below $76,000 would turn the current pullback (on Weekly timeframe) into a more serious correction.
Bitcoin Analysis for Next Week: Sell on rise for short term
The market view for next week is simple. The long-term trend on Weekly timeframe is up but the short-term trend on Daily timeframe is weak. Treat Bitcoin as a sell-on-rise market. The most likely path is a gradual decline toward $76,000 and then up.
Stocks are under pressure and ETF inflows remain inconsistent. This means buyers have little reason to defend current levels and sellers have the upper hand.
For ETFs, a bounce means little unless inflows continue for several days. Until then every rally is likely to face selling from investors who bought at higher levels. Altcoins face an even weaker setup.
JPMorgan sees Bitcoin as a possible hedge against monetary easing, making this an important event for the market. A dovish tone of the Fed could support risk assets. Expect sharp moves around the press conference.
The signal to watch is a strong daily close above $80,000 backed by sustained ETF inflows. A strong daily close above $80,000 would weaken our short-term bearish view.