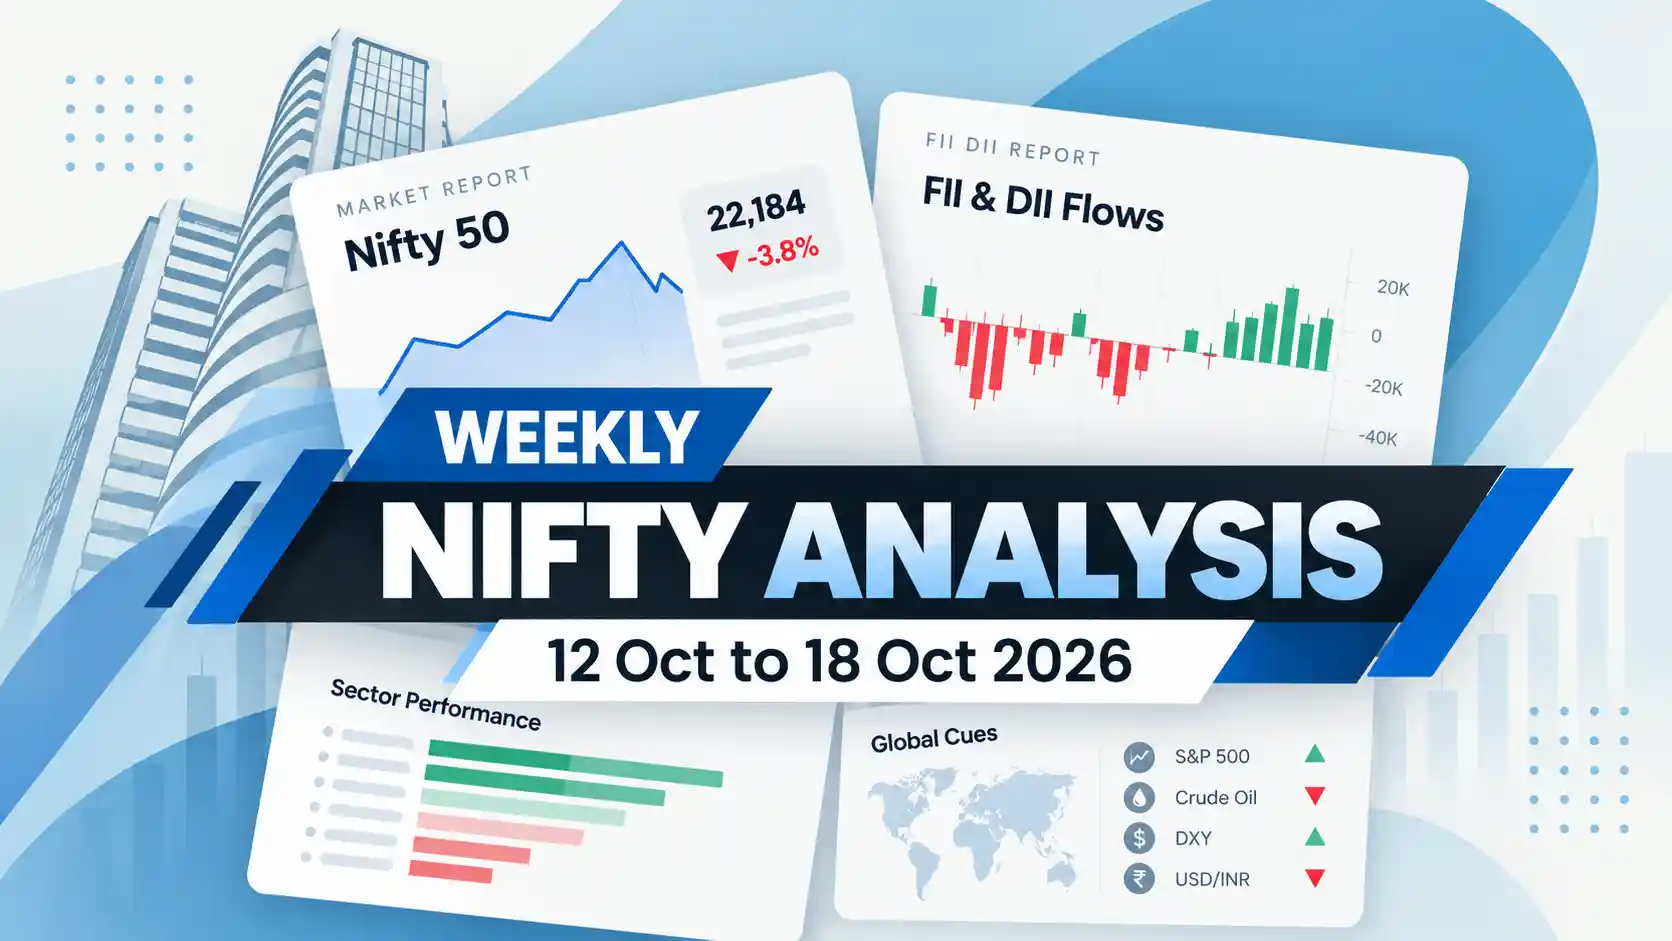

Nifty Analysis for Next Week starts with a small win in an otherwise weak market. Nifty rose 0.44% to 22,520.45, breaking its run of eight straight weekly losses. But FIIs still sold ₹30,294.29 crore over five sessions.
The week saw two sharp moves. On Thursday, Nifty fell 1.64% and made a fresh 52-week low of 22,179.90 as FIIs sold ₹12,943.58 crore. Friday then saw a 1.30% jump, pulling the index back up.
Our market view is clear. This is a risk-off, liquidity-driven market and the bounce looks like relief within a downtrend, not a trend reversal. Until FII selling stops, rallies are opportunities to sell and not buy.
Key Takeaways
- FIIs sold ₹30,294 crore while DIIs bought ₹30,313 crore. Domestic money again matched foreign selling almost rupee for rupee.
- The RBI hiked rates as expected and moved to calibrated tightening. So, cheap money is unlikely to return soon.
- Financials led the bounce, while Metal, Realty and Auto remained weak. This shows that the recovery was selective.
Nifty Analysis for Next Week: A Volatile Week
Nifty opened the week at 22,532.40 and closed at 22,520.45, up 0.44% from last week’s close of 22,421.95. The high was 22,776.10 on Tuesday, while the low was 22,179.90 on Thursday.
Friday’s 1.30% jump to 22,520.45 came after Brent cooled to around $92.40, having crossed $100 earlier in the week.
This tells us that crude oil is still the first trigger the market reacts to. When Brent crosses $100, concerns around the rupee and inflation push foreign money out. When oil cools, short sellers rush to cover.
It also helps to keep the damage in perspective. Nifty is down around 17%, which is mild compared with past crashes of 32% to 65%. The real pain is the time correction, as the market has struggled for around 25 months.
Many portfolios have lost far more than the index because individual stocks have fallen harder. That is why the mood feels worse than the numbers suggest.
Nifty Analysis for Next Week: Bank Nifty Outperforms the Index
Bank Nifty opened at 54,840.65, fell to a low of 54,370.60 on Thursday and made its weekly high of 55,419.30 on Friday. It closed at 55,256.65, up 1.48% from last week’s close of 54,450.75. That is more than three times Nifty’s 0.44% gain.
Financial Services rose 1.68% and Capital Markets rose 2.76%, so financial stocks led the bounce. Friday’s rise looks like short covering, as traders who had sold during the fall had to buy back once the index stopped declining.
The RBI raised the repo rate by 25 bps to 5.50% on 7 October and moved to calibrated tightening. Banks held up because higher rates can support lending margins, but the market now wants to see how much more tightening follows.
Nifty Analysis for Next Week: Top 3 Events
RBI raises the repo rate by 25 bps to 5.50% and shifts to calibrated tightening
The rate hike was widely expected so the real news was the change in stance. Calibrated tightening means rate cuts are off the table for now and the next move is either a hike or a pause. This raises financing costs for Realty and Auto and keeps pressure on other rate-sensitive sectors. Nifty fell on the day but then absorbed the news. September CPI on 12 October is the next test.
FIIs sell ₹12,943 crore on Thursday, the peak outflow of the week
The selling pushed Nifty to a fresh 52-week low of 22,179.90 before DIIs bought ₹10,703 crore. This shows that foreign selling can still overwhelm domestic buying during the session, even when DIIs match it by the close.Watch whether Thursday remains the peak for FII selling.
Friday’s 1.30% rebound lifts Nifty back to 22,520 on short covering
Financial and IT stocks led the move as Brent cooled to around $92.40. This broke the losing streak but FIIs still sold ₹3,569 crore, so the move looks more like short covering than fresh buying. The next signal is whether the bounce holds on Monday.
Nifty Analysis for Next Week: FIIs Sold ₹30,294 Crore
FIIs sold ₹30,294.29 crore this week, after selling ₹34,966.07 crore the week before. That is around ₹65,260 crore in just two weeks, with the biggest selling of ₹12,943.58 crore coming on Thursday.
Selling slowed by about 13%, but it did not stop. DIIs bought ₹30,313.48 crore, almost matching FII selling rupee for rupee. So, the index held up only because domestic money absorbed the selling.
When FIIs sell Indian stocks, they convert rupees into dollars. This increases dollar demand and pushes USD/INR higher, adding pressure on Nifty.
USD/INR is trading near all-time highs around ₹96, and the RBI is selling dollars to defend the rupee. With the dollar index near 102.30 and the Fed still data-dependent, the dollar side is not helping yet.
For FII selling to stop, USD/INR needs to stop rising. If FIIs start bringing dollars into India, demand for the rupee rises, USD/INR falls and Nifty can move up.
Friday gave us a clue. Nifty rose 1.30% even though FIIs still sold ₹3,568.90 crore. So, the bounce came from short covering, not foreign buying. A real shift needs FIIs to turn buyers for at least two sessions.
Nifty Analysis for Next Week: Sector Data
Sector data supports our view of a selective relief bounce. Capital Markets rose 2.76% and Financial Services gained 1.68%, so short covering was concentrated in sectors sensitive to interest rates and market flows. IT added 0.95% and Media rose 0.45%.
The first sign of a real recovery would be Metal, Realty and Auto stopping their fall. Until then, bounces remain sell-on-rise opportunities.
Nifty Analysis for Next Week: Nifty Option Chain Analysis
Option data shows a shift from last week. The Nifty PCR jumped to 1.27 from 0.68, suggesting that put writers are now in control and expect support to hold. The highest put OI moved up from 22,000 to 22,500, while the highest call OI at 23,000 still caps the upside.
Max Pain is at 22,500, the same level as spot, which points to a market staying near this level until the 13 October Nifty expiry. India VIX closed at 14.37, down from 15.28 on Thursday. So, fear has eased but has not disappeared. If 22,500 breaks during expiry week, put writers may have to hedge, which could push VIX higher.
Nifty Analysis for Next Week: Nifty Technical Analysis for Next Week
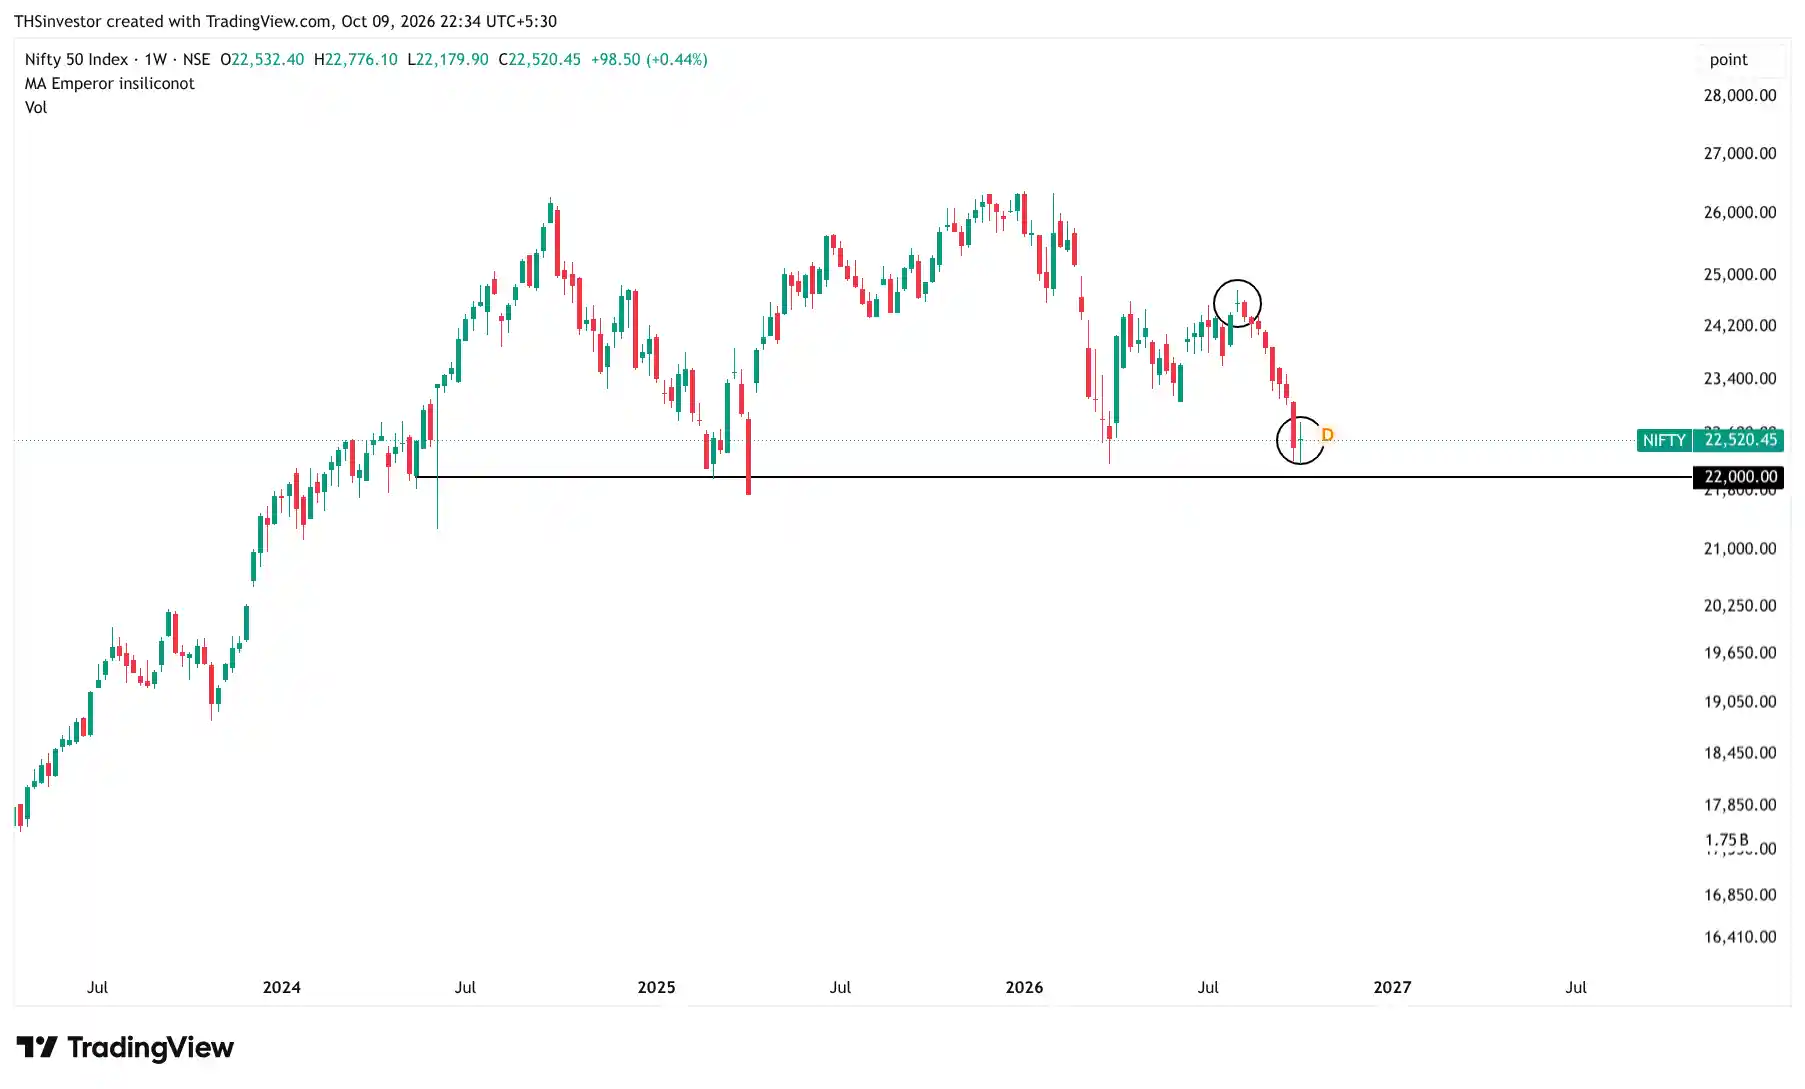
Nifty is still in a downtrend. The week ended with a doji weekly candle after eight straight red weekly closes. We were close to seeing a ninth red candle, but Friday’s 1.30% gain turned it into a doji. This shows how weak Nifty was through most of the week. Nifty Analysis for Next Week is about whether this doji marks a pause or turns out to be a trap.
Key Resistance:
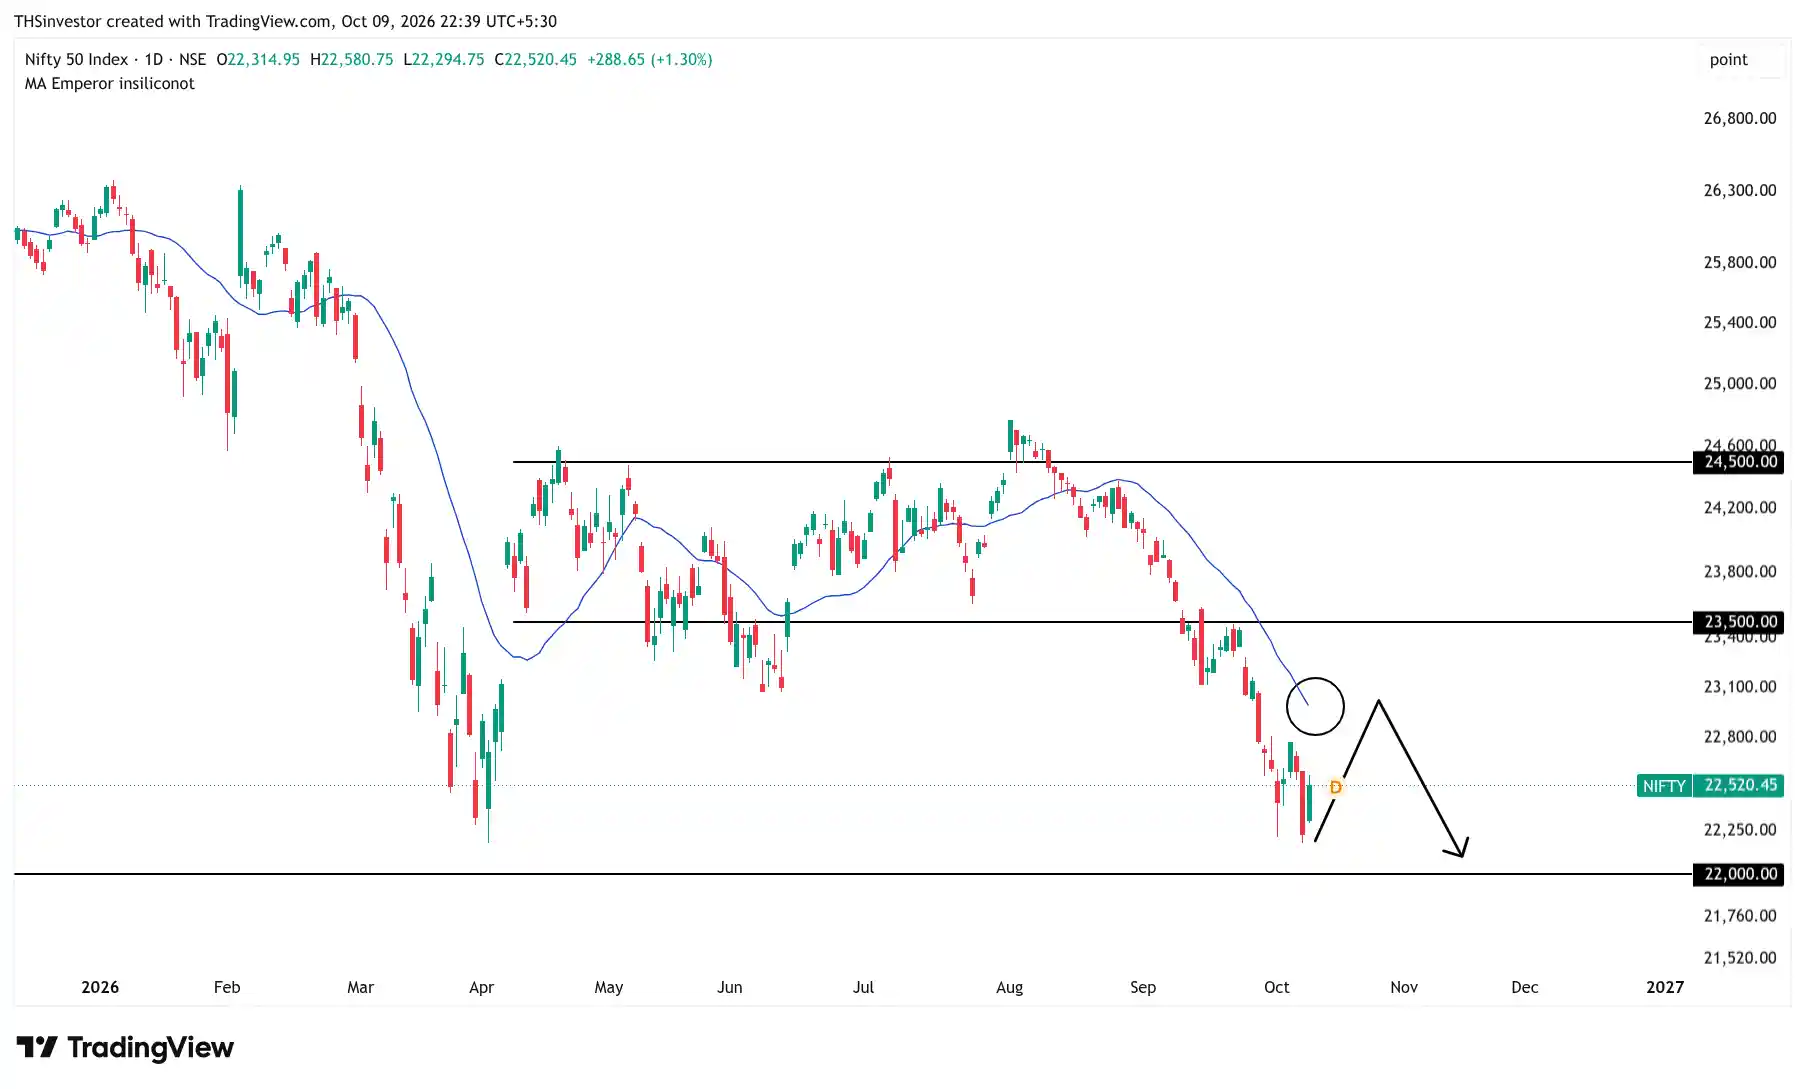
23,000 is the first resistance, where the 21 EMA stands. A pullback to this zone is the likely best-case scenario. Above that, Nifty needs to cross 23,500 and then 24,500. Both levels will act as immediate resistance.
Key Support:
22,000 is the last line of defence, and this week’s low of 22,179.90 came close to it. The more time price spends near 22,000, the weaker this support becomes. Nifty must build on Friday’s close. If 22,000 breaks decisively, there is no strong support until 21,000.
Momentum:
Weekly RSI is in the oversold region, and the daily chart showed RSI divergence, so a pullback is natural. But oversold conditions can last for weeks and this could still be a dead cat bounce. The USD/INR monthly chart has an RSI near 82, which is overbought. In the past, whenever it reached around 80, USD/INR moved down or sideways and Nifty started rising almost immediately. This could be a turning signal, but USD/INR needs to actually stop rising for it to play out.
Near-Term Setup:
The doji is a good first sign that buyers may be interested at these levels. But continuous FII selling makes us doubt whether the level will hold. Two things support a bounce. This could be a time correction after the powerful post-COVID rally, and historically, Nifty has bounced from the 21 EMA on its monthly chart.
Bias:
Sell on rise. This market is not for buying until Nifty moves above both 23,500 and 24,500. New positions should be taken in line with the downtrend, not against it.
Invalidation:
A close above 23,500 and then 24,500 would change this view. A decisive close below 22,000 would confirm a deeper fall towards 21,000.
Nifty Analysis for Next Week: Nifty View for Next Week
Market View:
The market view for Nifty Analysis for Next Week is risk-off and liquidity-driven with a relief bounce inside a downtrend. FIIs are still selling, the RBI has moved to calibrated tightening, and domestic buying is absorbing the supply. Our bias remains defensive, so bounces are chances to reduce risk, not add to it.
The key triggers are India CPI and IIP on 12 October, US CPI on 13 October and US Retail Sales on 15 October. India CPI is forecast at 5.10%, against 4.82% previously, so a hotter print would add to rate hike worries. But the bigger drivers remain USD/INR, FII flows and Brent crude.
Most Likely Case (50%):
The most likely case is a pullback that fades. Oversold conditions, short covering and DII buying could lift Nifty towards the resistance levels mentioned in the technical section. But if FIIs keep selling, sellers could return. Financials may hold up better, while Metal, Realty and Auto remain weak.
Bull Case (20%):
The bull case needs USD/INR to stop rising, FIIs to turn net buyers for at least two sessions, Brent to stay below $100 and CPI to come in below forecast. A close above the resistance levels mentioned in the technical section would confirm the move. Institutions could then cover their shorts, with Metal, Realty and Auto leading the recovery.
Bear Case (30%):
The bear case would be triggered by Brent moving back above $100, USD/INR making new highs, hotter-than-expected inflation or further RBI tightening. If the support mentioned in the technical section breaks, forced selling could follow. DIIs bought ₹30,313 crore this week and around ₹63,769 crore over two weeks. But domestic buying capacity is not unlimited.
Key Events to Watch Next Week
| Event | Date | Forecast | Previous |
|---|---|---|---|
| India Consumer Price Index (CPI) Inflation YoY (Sep) | 12 Oct | 5.10% | 4.82% |
| India Industrial Production (IIP) YoY (Aug) | 12 Oct | 4.2% | 4.8% |
| US Consumer Price Index (CPI) YoY (Sep) | 13 Oct | 2.3% | 2.5% |
| China Trade Balance (Sep) | 14 Oct | $88.5 Billion | $91.0 Billion |
| US Retail Sales MoM (Sep) | 15 Oct | 0.2% | 0.1% |
IPO Tracker This Week
| Company | M.Cap (Cr) | P/E | ROCE | Subscription |
|---|---|---|---|---|
| Pranik Logistics Limited | ₹62.80 | 15.11 | 21.36 | N/Ax |
| Shiv Texchem Limited | ₹412.00 | 16.53 | 24.53 | 14.80xx |
| R.K. Fashion Accessories Limited | ₹127.24 | 26.40 | 50.00 | 8.42xx |
| Acme India Industries Limited | ₹460.00 | 20.30 | 27.00 | 3.12xx |
| TNA Solutions Limited | ₹143.00 | 14.90 | 27.00 | 2.85xx |


![[2025] Why is Nifty falling? Explained. When will the fall stop?](https://thsinvestor.com/wp-content/uploads/2025/02/why-is-nifty-falling-768x384.webp)