

This Crypto Weekly Wrap covers September 21 to 27, 2026. Bitcoin closed the week at $84,456, up 4.0%. The main driver was ETF demand. Spot Bitcoin ETFs took in $2.39 billion, the strongest week of 2026. That flow confirmed the breakout above $82,000 that the weekly chart had been building for a month.
Rates pushed the other way. The 10 year Treasury yield hit 5.17%, its highest level since 2007. October hike odds moved above 60%. Bitcoin held anyway. That is the core read on this Crypto Weekly Wrap. Institutions are buying strength, not weakness. The trend is bullish. The next likely move is a retest of $82,000, not a reversal.
Key Takeaways:
1. ETF inflows of $2.39B confirmed the $82,000 breakout. Institutions are buying strength, not weakness.
2. Daily inflows faded from $999M on Monday to $134.5M on Friday. Demand is real but cooling.
3. Rates are the only real headwind. The 10 year yield sits near 5.17% and October hike odds are near 65%.
4. Bitcoin is bullish above $82,000. A retest of that level is the most likely next move.
5. Ethereum lagged Bitcoin and stays capped below $2,800.
Crypto Weekly Wrap: Bitcoin Weekly Analysis Shows Bulls Defending the $82,000 Breakout
Bitcoin opened this Crypto Weekly Wrap at $81,176 and closed at $84,456, gaining 4.0% and closing above the $82,000.
Monday drove the move. BTC surged to $87,363 before closing at $86,620, triggering nearly $919 million in short liquidations. The rest of the week was a pullback, but BTC held above $84,000 and volatility tightened.
The key point is the close, not the Monday spike. BTC finished $82,000 above the breakout level, with no strong selling follow through. Total crypto market cap ended at $2.88 trillion. Bitcoin dominance stood near 58.7%.
What matters next is $82,000. A retest is normal after the 7% spike. Buyers need to defend $80,900, the breakout candle low.
Crypto Weekly Wrap: Ethereum Weekly Outlook Stays Capped Below $2,800
Ethereum closed this Crypto Weekly Wrap at $2,689, up 1.7% from $2,645. Bitcoin gained 4.0%, so ETH captured less than half the move. That is the key signal. Ethereum is not leading this rally. Capital is still moving toward Bitcoin first.
ETH spiked to $2,807 on Monday but then gave back the gains. From Wednesday to Sunday, closes stayed between $2,684 and $2,696, showing limited fresh demand. ETH dominance stayed between 11.4% and 12.0%, confirming capital remains concentrated in Bitcoin.
The altcoin market outlook remains unchanged. Rotation into Ethereum has not started. The key levels are $2,600 support and $2,807 resistance. A daily close above $2,807 with rising volume would show ETH catching up.
Until then, ETH remains the slower Bitcoin trade.
Crypto Weekly Wrap: What Drove the Crypto Market This Week
Three forces moved the crypto market this week. ETF demand was the biggest. The other three were:
1. Short squeeze: Bitcoin cleared $82,000 on heavy volume Monday. Short positions above the range were forced to cover, pushing BTC to $87,363.
2. Hostile rate market: The Fed raised rates to 3.75% to 4.00% last week, while Fed speakers remained hawkish. Strong PMI data pushed the 10 year yield to 5.17%, with CME FedWatch pricing 64% odds of an October hike. Bitcoin did not sell. That relative strength matters.
3. Thinner exchange supply: About $2.52 billion in BTC left exchanges between September 22 and 24, according to CryptoQuant. Less BTC on exchanges means less supply available to sell. The market is trading liquidity first, fundamentals second. The squeeze, ETF demand and thinner supply drove price despite macro pressure.
Crypto Weekly Wrap: ETF Inflows Crypto Market Hits a 2026 Record
As per per Farside Investors, Spot Bitcoin ETFs attracted $2.39 billion this week, their strongest week of 2026 and enough to turn year to date flows positive. This was the main driver of the Crypto Weekly Wrap. Bitcoin broke $82,000 as institutions bought the move.
Flows weakened each day, from $999M Monday to $134.5M Friday. Demand remains strong but is cooling.
BlackRock's IBIT led with $1.16 billion, followed by FBTC at $702 million. The average ETF cost basis is near $81,700, making $82,000 an important level for ETF holders.
Solana ETFs also attracted about $188 million, showing selective institutional demand.
Crypto Weekly Wrap: Key Events That Shaped the Week
Bitcoin ETFs Record $999M in One Day, the Largest Inflow of 2026
US spot Bitcoin ETFs took in $998.95 million on Monday, September 21. IBIT added $381.4 million, ARKB added $289.1 million and FBTC added $238.8 million. The buying landed as Bitcoin cleared $82,000 and squeezed shorts. The inflow pushed price above the ETF holder cost basis near $81,700. That turned a chart breakout into a confirmed institutional move. The market now treats $82,000 as a level ETF buyers will defend.
10 Year Yield Hits 5.17% and October Hike Odds Climb Above 60%
The 10 year Treasury yield reached its highest level since 2007 after hawkish Fed comments and strong PMI data. CME FedWatch priced about a 64% chance of a 25 bps hike at the October 27 to 28 meeting. Higher yields raise the cost of holding risk assets. Bitcoin pulled back from $87,363 to the $84,000 zone but held its breakout. This is the main macro risk to the trend. A 10 year yield above 5.25% would raise pressure on price.
Strategy Buys 1,665 BTC and Lifts Holdings to 847,666
Strategy disclosed in its SEC filing that it bought 1,665 BTC between September 21 and 27 at an average of $85,681, for $142.7 million. Holdings now stand at 847,666 BTC. The size is small next to ETF flows. The signal is the price. Strategy kept buying above $85,000, which shows corporate demand is not waiting for a pullback. This adds a second buyer beside ETFs at the top of the range.
Crypto Weekly Wrap: Bitcoin Technical Analysis After the Weekly Breakout
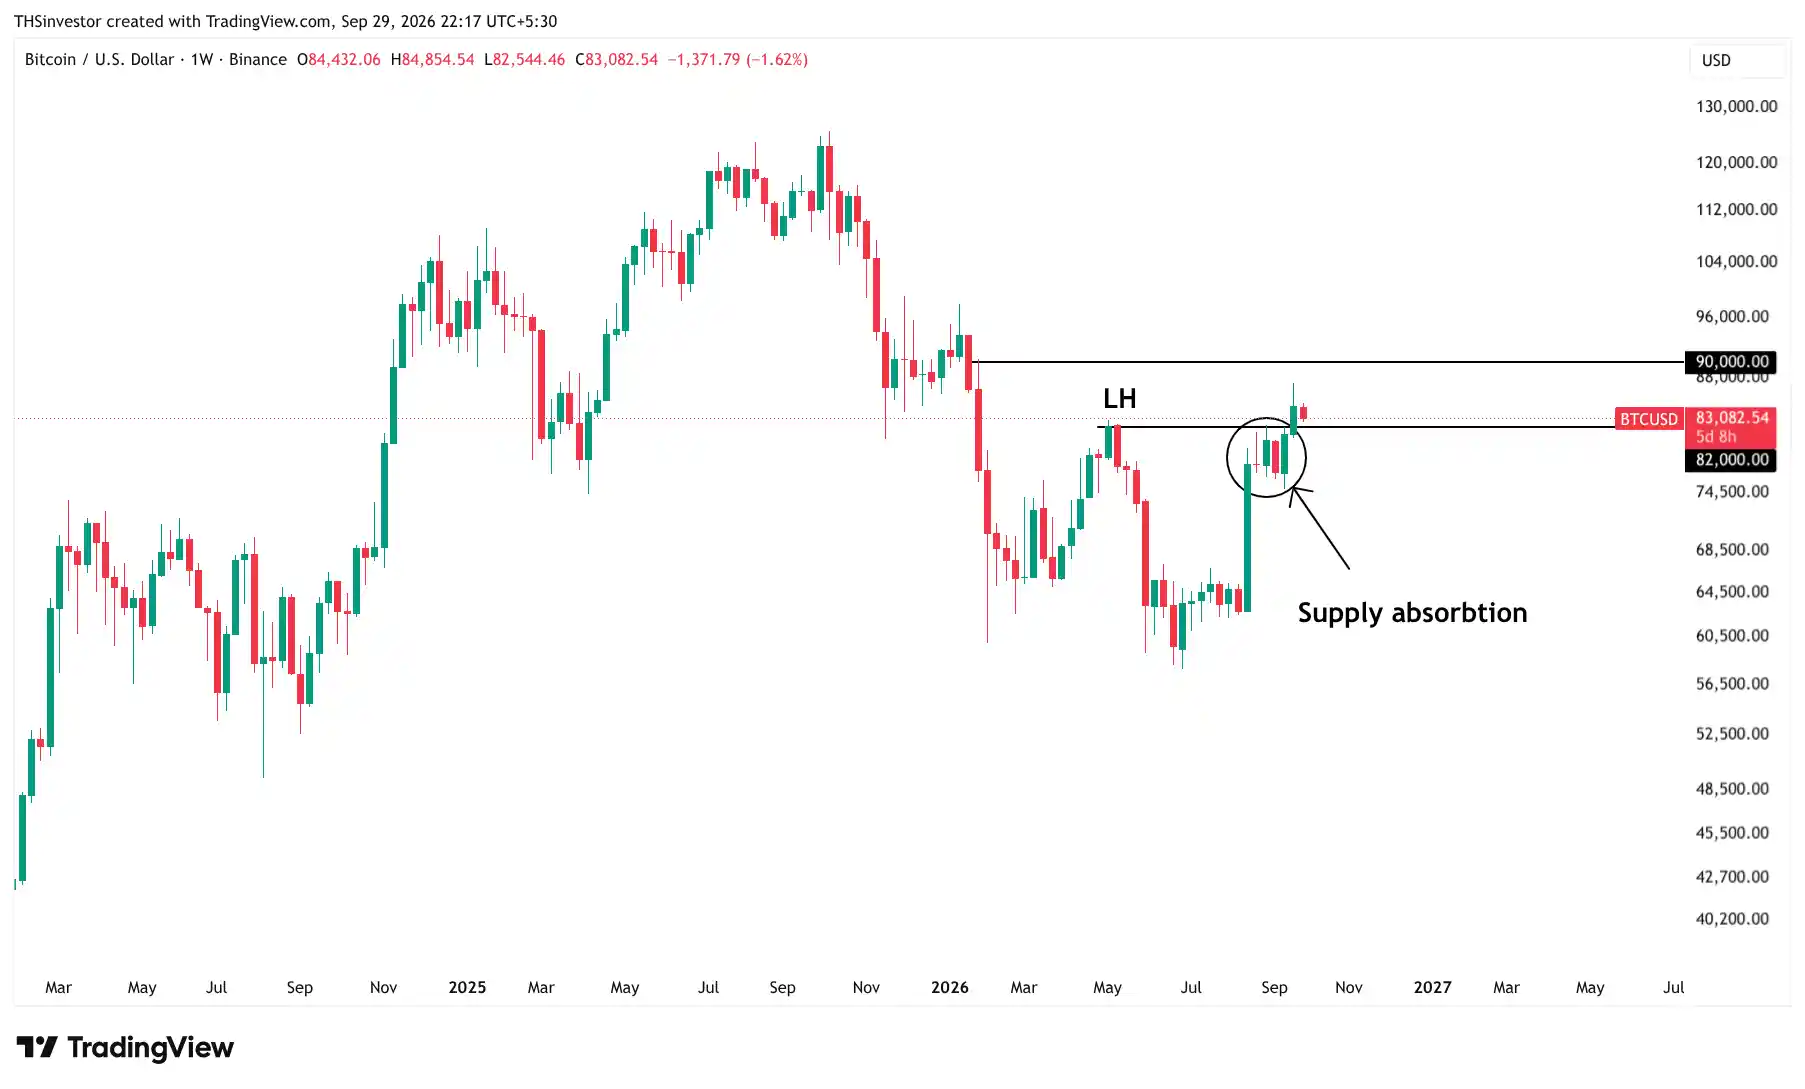
Now buyers need to defend the low of the breakout candle.
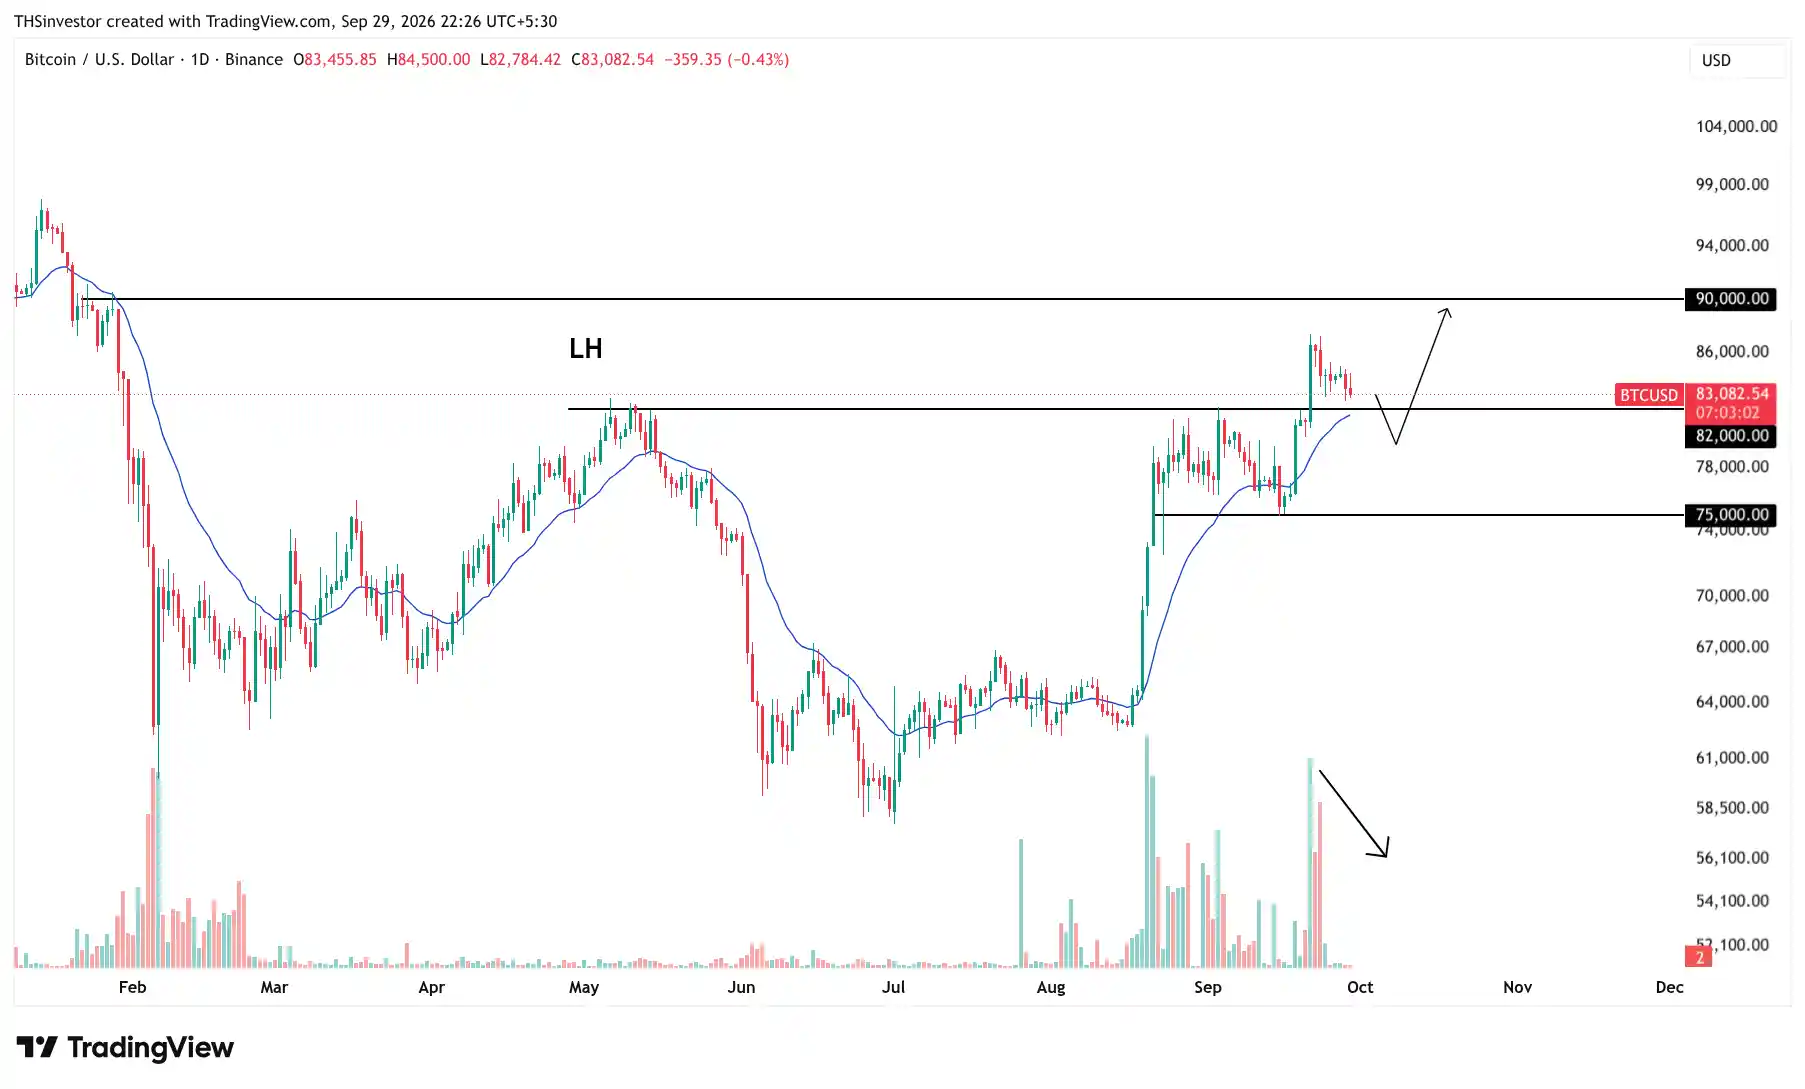
The market is not bearish. Buyers are clearly in control. The next possibility is a retest of $82,000, where the 21 EMA sits. Buyers are likely to defend this level.
Price could also briefly dip below $82,000, trigger stop losses and then move higher. Watch volume closely for confirmation of the next move.
The next major resistance is $90,000. Do not consider shorts while Bitcoin remains above $75,000.
Crypto Weekly Wrap Outlook: Base Case, Bull Case, Bear Case
This Crypto Weekly Wrap outlook remains bullish while Bitcoin holds above $82,000.
Base case: Bitcoin retests $82,000, where the 21 EMA sits. It may briefly dip below and clear stop losses before buyers defend $80,900. The market then consolidates between $82,000 and $87,000 as ETF flows remain positive but slow.
Bull case: ETF flows stay near $300 million a day, yields stabilise and October hike expectations fall. Bitcoin breaks $87,363 on rising volume and targets $90,000. Ethereum breaks $2,807, opening the door for broader altcoin rotation.
Bear case:Yields rise above 5.25%, hike expectations increase and ETF inflows fall below $100 million a day. A weekly close below $80,900 would weaken the breakout and expose $75,000.
The next major macro event is the October 27 to 28 FOMC meeting. Until then, watch ETF flows and volume. Flows show whether institutions are still buying. Volume confirms whether the next move toward $90,000 has strength.