
This Indian Market Weekly Wrap yet another red week. Nifty fell 0.88% to 23,140, extending the losing streak to seven weeks. The main pressure came from three things: FII selling, rising US yields and crude oil moving back above $100. The IRDAI proposal to cut insurance commissions added another layer of selling pressure.
FIIs sold ₹11,490 crore. DIIs bought ₹16,398 crore and absorbed most of the selling. The important part is that Nifty is now testing 23,000. The level is holding for now, but the weekly structure remains weak.
Key Takeaways:
• FIIs sold ₹11,490 crore while DIIs bought ₹16,398 crore.
• Financial Services and IT were among the weaker sectors. Realty, Defence and Metals managed to stay positive.
• Market breadth remained close to balanced. This looks more like a slow grind lower than broad capitulation.
• Insurance stocks faced selling because of regulatory risk after the IRDAI proposal.
• Nifty remains below its major weekly moving averages.
• 23,000 is the key level to watch. A break could open the way toward 22,000 to 22,200.
Indian Market Weekly Wrap: Nifty Weekly Analysis and Performance This Week
As per NSE India, Nifty fell 0.88% this week and closed at 23,140. That makes it seven consecutive weekly declines.
Thursday was the main damage. Nifty fell 1.64% after the IRDAI news. Friday managed a 0.34% recovery, but that was not enough to change the weekly structure. 23,000 is now the key level.
The index has managed to hold it so far, but the bounce needs to come with actual buying volume. Small intraday recoveries are not enough to change the structure.
Support: 23,000
Resistance: 23,500
Indian Market Weekly Wrap: Bank Nifty Outlook and Weekly Performance
Bank Nifty was weaker than Nifty. It fell 1.39% during the week versus Nifty's 0.88% decline. Thursday was again the biggest move, with Bank Nifty falling 1.96%. Financial stocks took more pressure from the IRDAI proposal and the broader rate environment.
For now, 56,500 remains the important level. Until Bank Nifty can reclaim and hold above 56,500, the index remains weak.
Support: 55,000
Resistance: 56,500
Indian Market Weekly Wrap: Sector Rotation and Performance
Sector performance was quite selective this week. Only Realty, Defence and Metals managed to close higher. Financial Services and Capital Markets were directly hit by the IRDAI proposal. IT was also among the weaker sectors as the broader risk-off environment continued.
The important point is that the positive sectors did not show broad market participation. This looks more like sector rotation than a confirmed market bottom.
Indian Market Weekly Wrap: FII Selling Impact on Indian Market
FII selling remained one of the biggest themes this week. They sold on four out of five sessions and ended the week with ₹11,490 crore of net selling. DIIs went in the opposite direction. They bought ₹16,398 crore and more than absorbed the foreign outflow.
So, the domestic money is still providing support, but it has not been enough to reverse the broader trend. The bigger question is whether FII selling continues as US yields remain elevated.
Indian Market Weekly Wrap: F&O and Options Market Positioning
Nifty's Put Call Ratio based on open interest was around 0.92 to 0.93, suggesting a neutral to slightly bearish setup.
Max Pain: 23,250
The largest Call Open Interest is around 24,000, making it an important resistance zone and largest Put Open Interest is around 23,000, making it the key support zone.
Bank Nifty looks weaker. Its PCR OI is around 0.80, pointing to a more bearish positioning.
Max Pain: 56,500
Highest Call OI: 56,500
Highest Put OI: 55,000
IPO Tracker This Week
| Company | M.Cap (Cr) | P/E | ROCE | Subscription |
|---|---|---|---|---|
| A-One Steels India | ₹1564 | 21.7 | 12.86 | 1.35xx |
| Moneyview | ₹3925 | 16.1 | 14.1 | 1.70xx |
| Runwal Enterprises | ₹4507.44 | 24.26 | 17.20 | 0.44xx |
| Orient Cables India | ₹3080 | 57.51 | 24.10 | 1.52xx |
Key Events to Watch Next Week
| Event | Date | Forecast | Previous |
|---|---|---|---|
| China Caixin Manufacturing PMI | 28 Sep | 50.4 | 50.1 |
| US JOLTS Job Openings | 29 Sep | 7.23M | 7.27M |
| US ISM Manufacturing PMI | 1 Oct | 54.8 | 54.6 |
| US Non-Farm Payrolls | 2 Oct | 100K | 162K |
| Eurozone Flash HICP YoY | 2 Oct | 2.1% | 2.2% |
Indian Market Weekly Wrap: Key News and Market Triggers
IRDAI Proposes Insurance Commission Cuts
IRDAI's proposal to cut broker and agent commissions across health and auto insurance triggered a single-session wipeout of ₹3.93 lakh crore in market wealth and crashed PB Fintech by roughly 36%, repricing insurance distribution stocks on regulatory risk rather than earnings.
Crude Oil Above $100 Pressures the Rupee
Renewed West Asia tensions pushed Brent crude back past $100 a barrel, worsening India's fiscal deficit outlook as an oil-importing economy and pushing the rupee to test its ₹96 record support level.
US Bond Yield Surge Drives FII Outflows and Extends the Losing Streak
A sharp rise in US Treasury yields on elevated inflation expectations pulled ₹11,490 crore in FII outflows from Indian cash equities this week, extending Nifty's decline to a seventh straight week and breaking it below all major weekly moving averages.
Indian Market Weekly Wrap: Nifty Technical Analysis
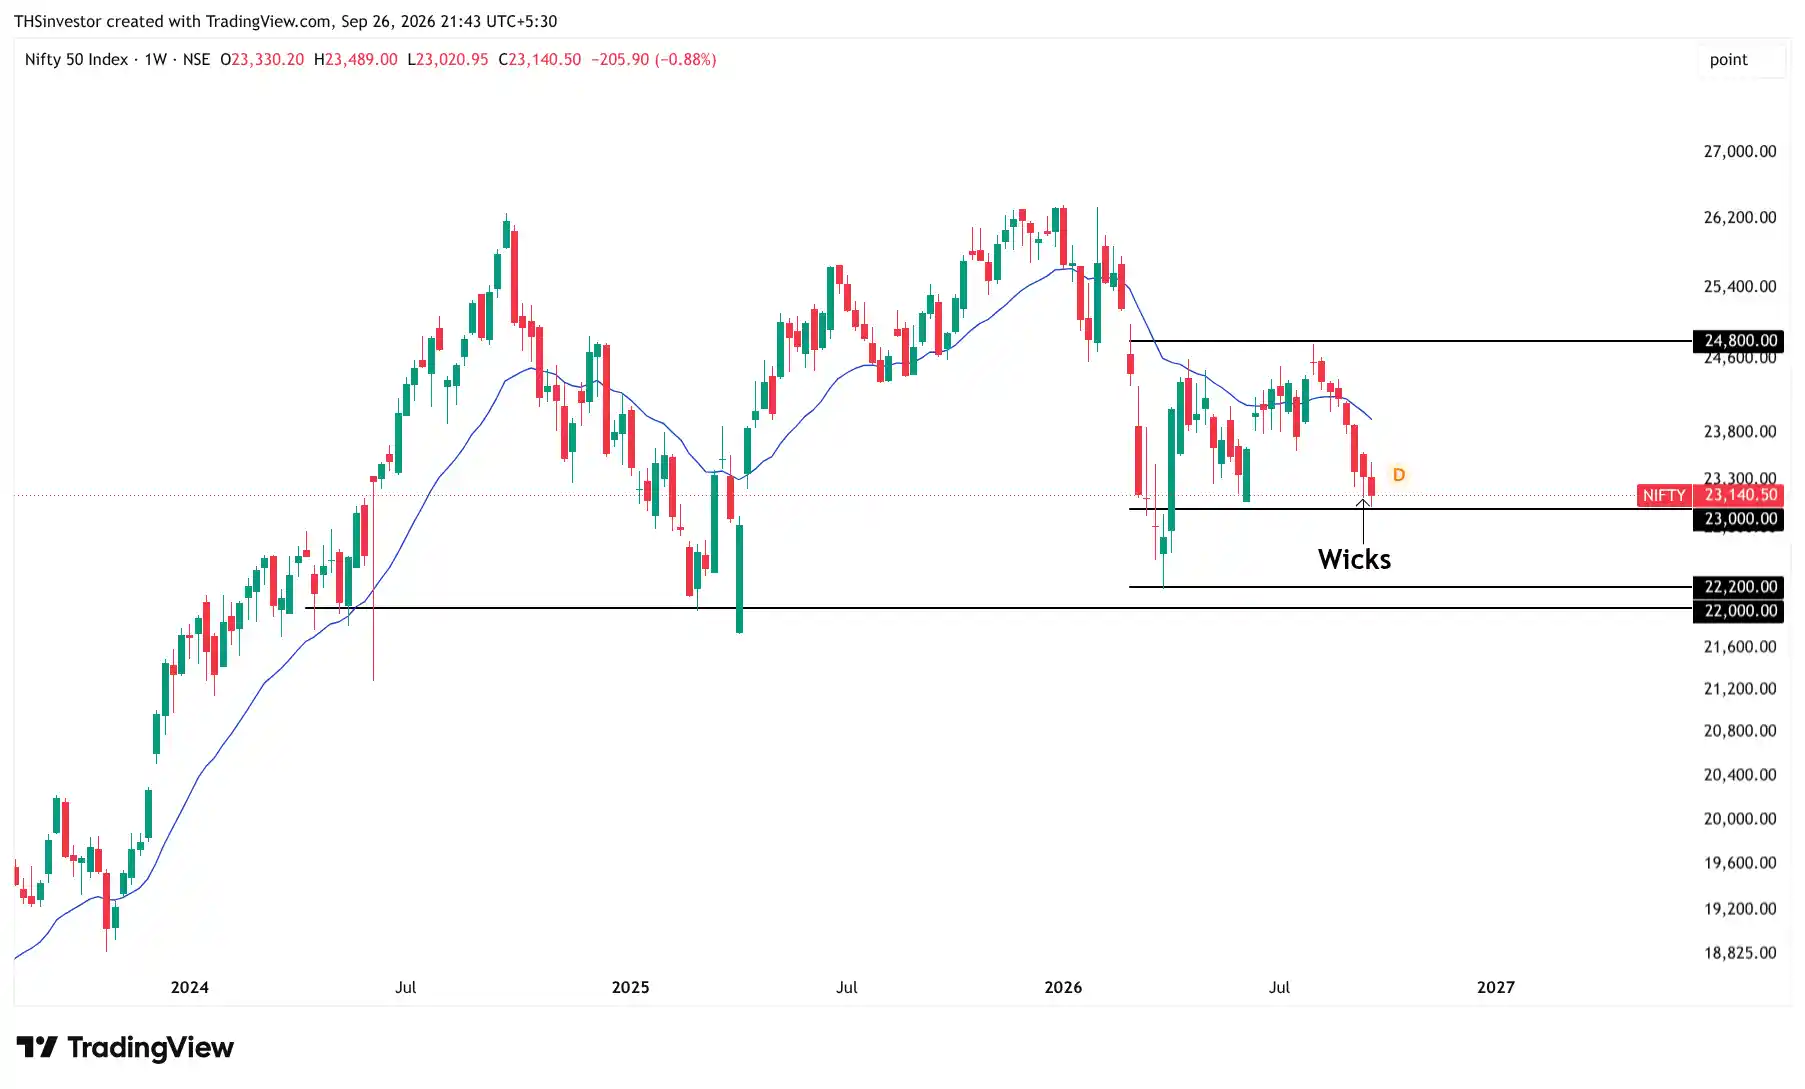
What makes this more interesting is that weekly RSI is still at 37.40, which means the market is not technically oversold yet. Despite seven consecutive weeks of decline, Nifty has been moving down slowly and steadily on weekly timeframe rather than seeing the kind of sharp capitulation that usually pushes RSI deep into oversold territory.
There are also a few positive signs on the weekly chart. Nifty is now close to 23,000, which is an important technical support and the recent weekly candles are showing small lower wicks around this level, suggesting that buyers are showing interest around 23,000 even though sellers are still in control.
If Nifty fails to hold 23,000, the next meaningful support is around 22,000 to 22,200, so that is the next zone to watch rather than trying to predict every small move below 23,000.
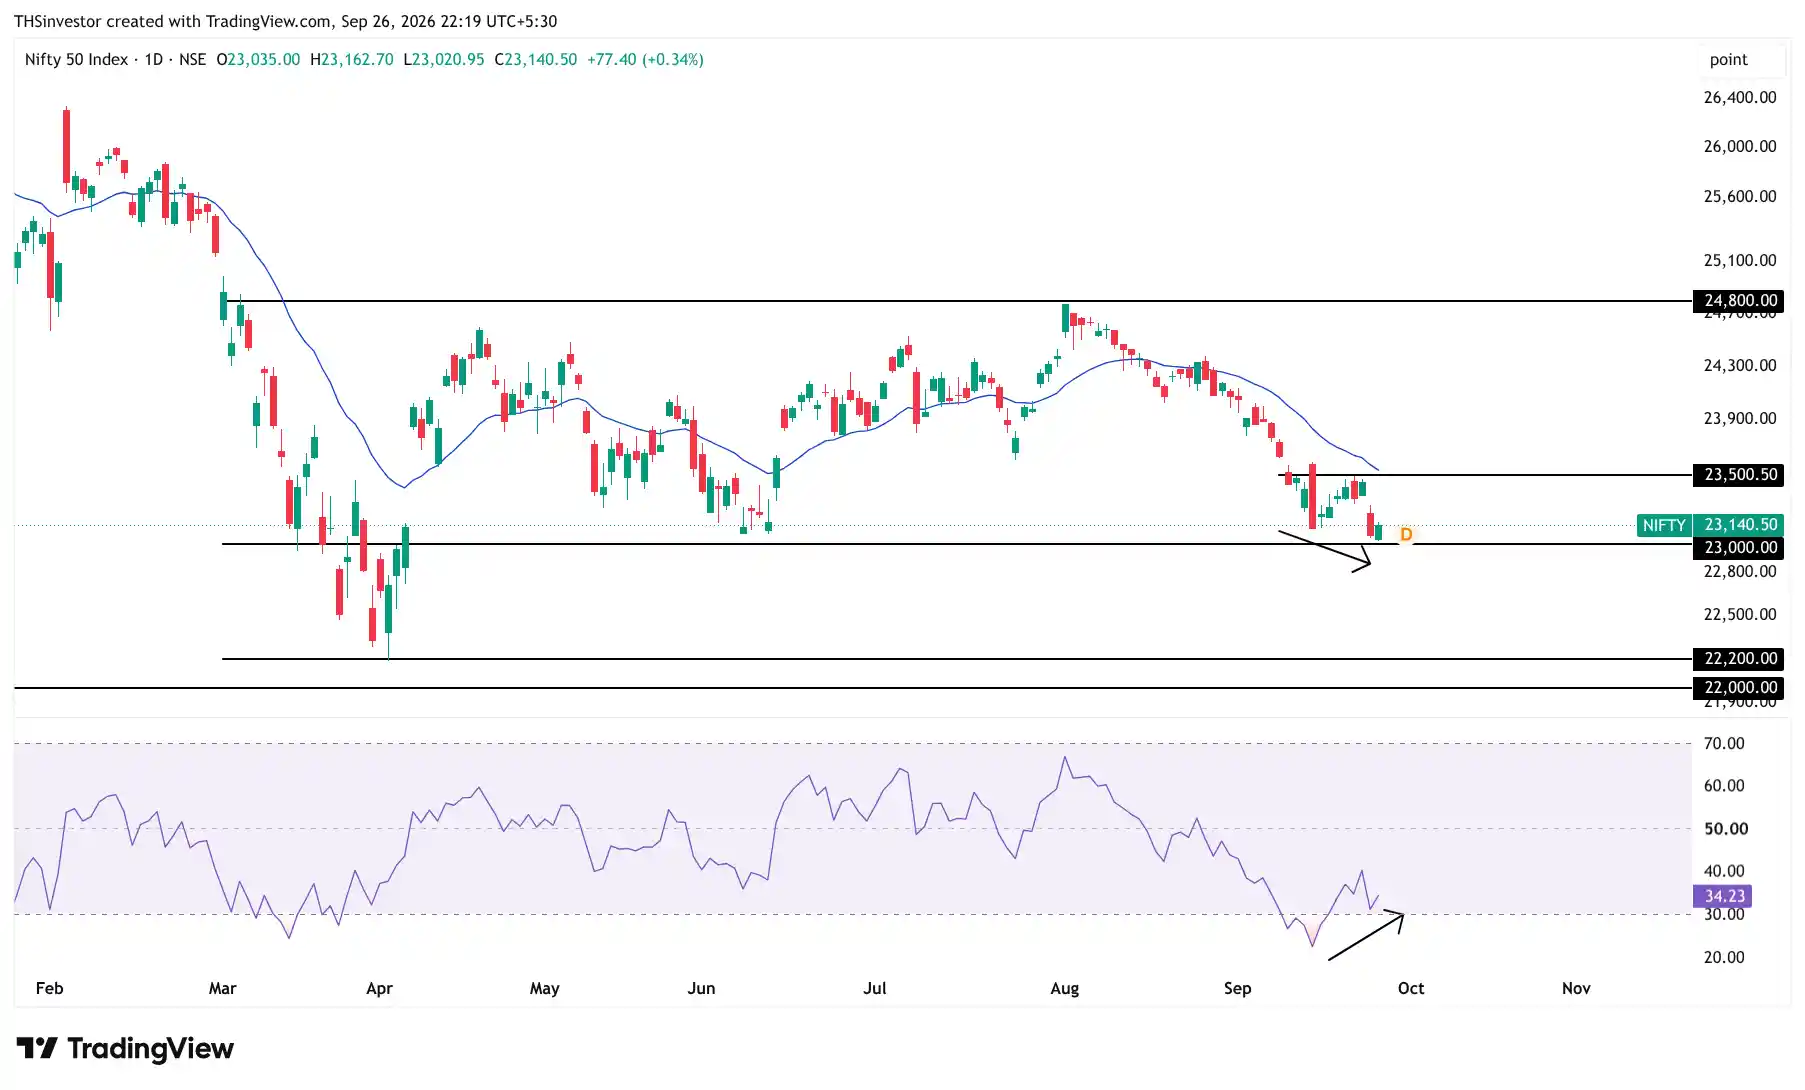
This is why chasing fresh shorts aggressively around the current levels is not reasonable, but also the RSI divergence is not to be treated as a reason to start buying. The broader structure is still bearish, so the setup remains sell on rise until the index gives a proper strength signal.
The first meaningful sign of strength would come if Nifty can reclaim 23,500, which is also around where the 21 EMA is sitting. Above that, 24,800 remains the bigger resistance on the higher timeframe.
So the setup is fairly simple: 23,000 is the key support, 22,000 to 22,200 is the next downside zone, and 23,500 is the first level that can start changing the short term structure.
For now, this is not a market to buy blindly, but it is also not the best level to keep chasing fresh shorts The better setup is to wait for either a breakdown below support or a pullback into resistance and then see how price reacts.
Indian Market Weekly Wrap: Outlook for the Indian Stock Market This Week Ahead
The base case remains a continuation of the downtrend, with Nifty now in its seventh consecutive red weekly candle. Crude above $100, a weakening rupee and rising US bond yields are still working in favour of sellers, although the positive RSI divergence on the daily chart leaves room for a short term bounce.
The bull case is straightforward: crude cools from above $100 and the rupee stabilises below 96. That could reduce pressure on FII flows and give Nifty enough room to reclaim the key resistance at 23,500.
The bear case is the opposite. If crude stays elevated, the rupee continues testing 96 and FIIs keep selling into rallies, the pressure can continue. A break below 23,000 would strengthen the downtrend and bring 22,000 to 22,200 into focus.
The biggest swing factor next week is US labour market data. Non Farm Payrolls are expected at 100K versus 162K previously, so a weaker number could ease pressure on bond yields and reduce the pressure behind FII outflows, while a stronger number could keep the current pressure in place.
Domestically, crude remains an important problem because higher oil prices limit the RBI's room to ease policy. Nomura has also flagged the possibility of two rate hikes instead of rate cuts, making RBI commentary and rupee movement important variables for the market.
DII buying should continue absorbing FII supply, just as it did this week with ₹16,398 crore of buying, but so far this has supported the market rather than changed the broader trend.
For now, the setup is simple: 23,000 is support and 23,500 is resistance. The market is likely to remain stuck between these levels until either macro conditions improve and Nifty reclaims resistance or continued pressure breaks support and opens the way toward 22,000 to 22,200.