
Fibonacci Levels
Fibonacci levels, derived from the Fibonacci sequence, are used in technical analysis to identify potential areas of support and resistance.
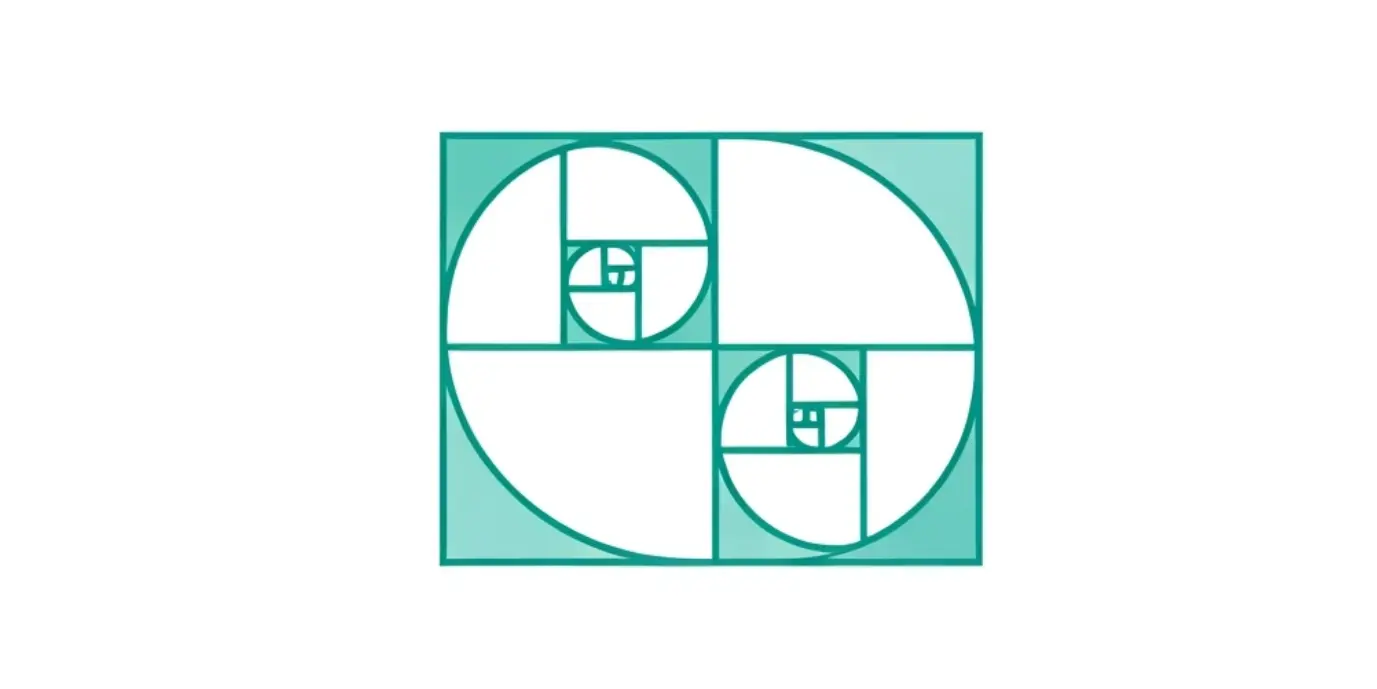
Fibonacci sequence is a mathematical series where each number is the sum of the two preceding numbers – 0, 1, 1, 2, 3, 5, 8, 13, 21, 34…
Fibonacci ratios which are widely used in trading are 23.6%, 38.2%, 61.8%, and 78.6%. But we will restrict our studies to 38.2%, 50% and 61.8% to keep things simple.
In fibonacci series, if a number is divided by next number, we get approx 61.8% eg (21/34)x100 = 61.8%
And if a number is divided by number two places to the right, we get approx 38.2% (13/34)x100 = 38.2%
Fibonacci Levels – Retracement
Fib retracement is a tool that is used to find Support and Resistance on retracement of existing trend. This is used by traders to take entry in trades.

This tool can be found on any trading platform. To draw fib retracement, set start of trend as initial point (A) and swing high (B) as the final point. The tool marks the fib ratios on the chart.
The swing high and swing low is to be selected as the initial and the final point respectively in case of a down trend.
We can see in the above example how well the price is respecting the 50% zone. 50% is nothing but 50% retracement of price from swing high.

Another example which shows price taking resistance at 38.2% in a down trend.
Fibonacci levels – Extensions
This is another tool based on fibs ratios which is used by traders to find potential levels to book profits and exit the trades.

To draw it, we need 3 data points, from the start of a trend (pt A) till high of the trend (pt B) and low of the retracement (pt C). The tool will project Fibs ratio for the next leg of up move.
The opposite can be done for a downtrend move.
The above example shows, price after retracement takes resistance at 61.8% which is nothing but the 61.8% of trend from pt. A to pt. B.
Criticism of Fibonacci levels and tools

- If you look at the above chart, there are multiple fibs ratios (trying to find retracement in down move) and price will find resistance at some or the other ratio. It is hard to predict which ratio will the price respect. Also, there are many support resistance zones created by price on the left side of the chart.
- These ratios appear random to many and that is correct. Many believe traders try to fit any ratio retrospectively to justify that these ratios work.
- Traders select different points for swing high and low which lead to different results.
How to use Fibonacci levels and tools correctly?
The question you should be asking yourself is why should you be using Fibs tools when Support Resistance zones made by price action works just fine.
Well, there are cases when this tool can be of help;
- When there is no or little price action available to the left side of the chart in recent times.

The stock was listed recently and price history is not available. This is where we can use Fib retracement to take entry. We can see price falling and taking resistance at 61.8% retracement.
Also this level is around the S/R zone. Type of candles formed around these levels also help build our confidence further, in the above example, a rejection candle formed with a big upper wick.
Additionally we can make educated guess chances of 61.8% working is more than 38.2% as price has fallen too much from the highest levels without much pullbacks and bigger pullback maybe on cards.
Again, there are good chances that 61.8% does not work but we do need some level to enter. We can bet on these levels as many traders place orders around these numbers and this improves our probability more than 50%.
Now, let’s try to find out the exit point using the Fib extension tool.

We can see the price taking support near the 61.8% zone which is a decent point to book profits after entering at point C.
So, basically when we cannot establish SR zones with the help of price, we can use Fib tools. Additionally, we can use the confluence of SR zones of price action with fibs levels.
- When price moves in one direction quickly without giving much retracements.

The above example shows price fall in one direction with no retracement. Applying Fib retracement from point A to B, we can see price reacting near 38.2% level.
Why do these Fibonacci levels work?
- Many traders are placing orders around these levels, hence price is bound to react. Many algos are using these ratios.
- 38.2% and 61.8% are near the 50% mark which is a psychological number.
- These ratios are believed to be building blocks in some natural elements and hence also imbibed in human nature. It is natural for humans to react around these ratios.
Key Takeaways
- Avoid using Fibonacci levels on lower time frames.
- One should not consider these Fibonacci levels magical rather see these as points to enter and exit to manage risk.
- Fibs levels work only in trending markets.
- Never use Fibonacci levels in seclusion, try to find confluence with price action, RSI oversold, overbought, divergences etc.
- There are many Fibonacci levels and ratios, restrict yourself around 38.2% and 61.8% as they are near the 50% mark which is a psychological number. Also, more ratios will make working with Fib difficult.
- Use Fibonacci levels when SR zone cannot be spotted due to absence of price action in recent times.

