
What is Volume Profile?
Volume profile is a tool that shows volume traded at different price levels whereas traditional volume bars at the bottom of the chart represent volume traded at different points of time.

Volume profile gives us a range where market participants have shown interest and zone with maximum volume act as good support/resistance.
Elements of Volume Profile

- Point of Control (POC)
Point of Control aka POC, is the price area/zone with high volume activity. Both buyers and sellers see this zone as a pair price to buy and sell thus creating a temporary equilibrium.
In a range bound market, when the price moves far from the POC, traders often expect a return to this equilibrium level unless the trend is strong.
If the trend is strong with price breaking out of POC, POC gradually shifts in the direction of the trend, reflecting the market’s acceptance of new price levels.
- High Volume Nodes (HVN)
These are zones with significant volume activity, where price can potentially encounter support/resistance, hence price movement through such zones may not be very smooth.
- Low Volume Nodes (LVN)
These are zones with little to no volume activity. In such areas, price can move significantly without encountering any hindrance.
How to use Volume Profile?
- HVN as Resistance

Price has fallen from point A to point B, across which volume profile has been applied. When price starts to move up, we can see how price is facing resistance around HVN.
This happens because market participants see these zones as fair zones to buy/sell and everytime price comes near such zones, buyers and sellers initiate trades desisting price to move smoothly through such zones.
- Breakouts of HVN

Volume profile is being studied from the start (A) and end point (B) of recent uptrend. We can observe, as the price breaks the HVN zone, price moves smoothly without much hindrance.
On similar lines, we can expect prices to find support near the next HVN.
- Volume Profile shapes
The shapes of Volume Profile are visual representations of how trading volume is distributed across different price levels over a given period which reflect market behavior and trader psychology.
Mainly, there are 3 shapes:
- P shaped

In this, high volume is concentrated at the top of the volume profile after an up move which shows price acceptance at the top by buyers and sellers. Traders should be looking for an upside breakdown and bearish positions should be avoided.
- b shaped

In this, high volume is concentrated at the bottom of the volume profile after a down move which shows price acceptance at the bottom by buyers and sellers. Traders should be looking for a downside breakdown and bullish positions should be avoided.
- D shaped

D shaped volume profile represents a range bound market where max volume is distributed at the middle of volume profile. Traders should look for breakout on either side before entering a trade.
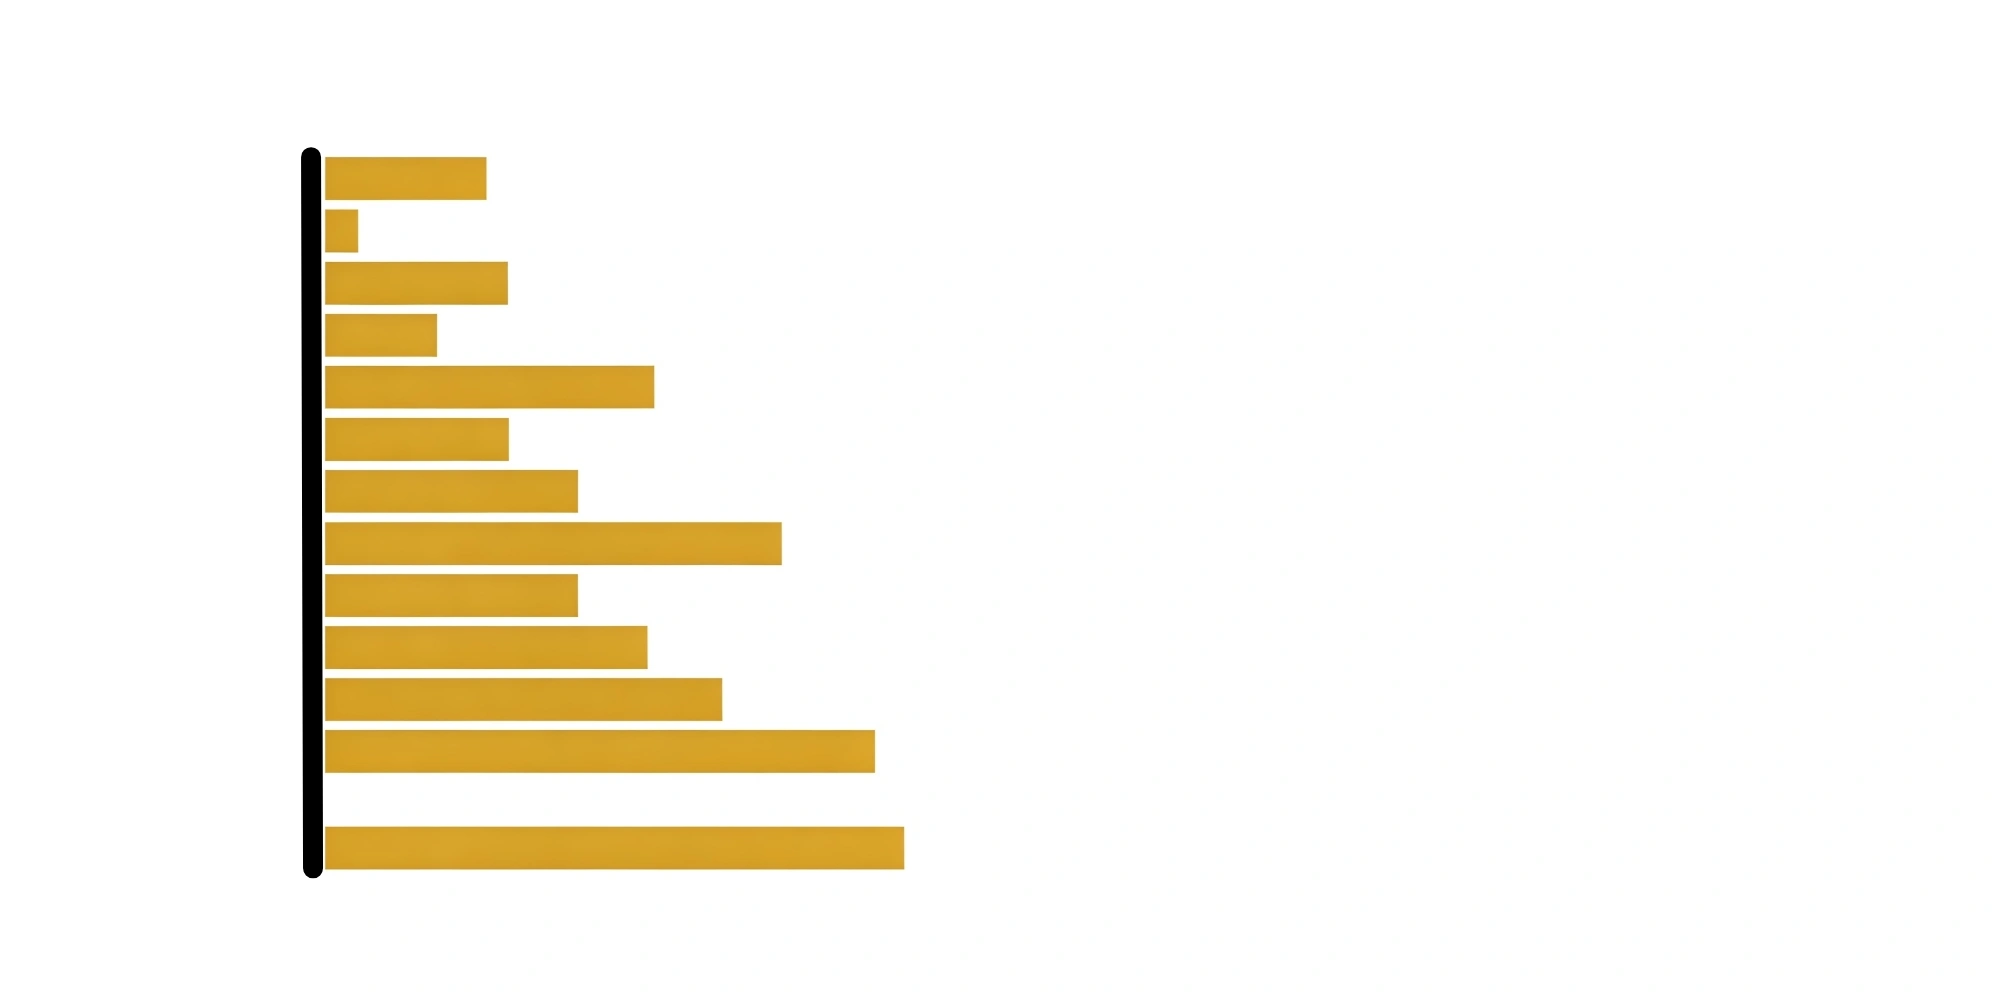
- Shifting of POC
In a healthy trend, we observe price movement in a direction and then consolidation before the next leg of trend continuation. Ideally, POC should shift with every consolidation for a trend to sustain.

In the above example we can observe, as the price is going down, POC is shifting down (represented by a dark black line) with every consolidation until point A where we can see consolidation but POC has not shifted down and price gets trapped in a range.
This shows weak trading activity and the lower price is not being accepted by buyers and sellers, so shorting the market further should be avoided.
Key Takeaways
- Definition: Volume Profile shows traded volume at different price levels, unlike time-based volume bars.
- Purpose: Highlights key areas of support/resistance based on high volume zones.
- Key Components:
- POC: Zone with highest volume; often acts as equilibrium.
- HVN: High-volume areas acting as resistance/support.
- LVN: Low-volume areas enabling swift price movement.
- Shapes:
- P Shape: High volume at the top; avoid bearish positions.
- b Shape: High volume at the bottom; avoid bullish positions.
- D Shape: Range-bound market; wait for breakout.
- POC Shifting: A healthy trend shifts POC with consolidation; stagnant POC signals weakness.