
What is Moving Average Convergence Divergence ?
MACD (Moving Average Convergence Divergence), is a popular indicator used to identify trend and momentum of the trend. Based on calculation and combination of exponential moving averages, it also provides the entry and exit points.
MACD should only be used in a trending market.
Moving Average Convergence Divergence – Components
 1")
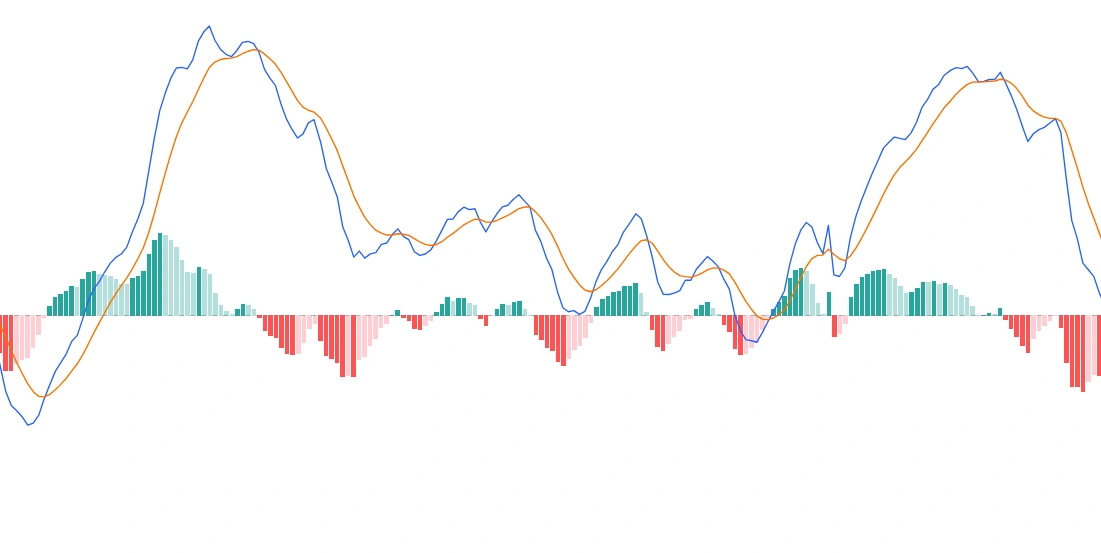
- MACD line: it is the difference between EMA (12) and EMA (26), represented by a blue line, which is the preset setting in the indicator and can be changed. MACD line oscillates around a central value (zero line).
Whenever 12 EMA crosses 26 EMA from below, MACD goes above zero line and vice-versa as represented by the two vertical lines.
- Signal line: it is 9 EMA of MACD line, represented by orange line.
- Histogram: it is the difference between MACD line and Signal line. Increase/decrease in size of bars of histogram signifies the increasing/decreasing momentum of price.
Moving Average Convergence Divergence – Applications
- Crossovers
 2")
First of all, MACD should only be used when one is convinced that we are not in a range bound market.
For long trades, MACD line (blue line) should be above zero line (this happens when 12 EMA > 26 EMA) and Signal line. Whenever both conditions are fulfilled, enter.
In the above example, the blue line goes above zero and the signal line at point A which has to be the entry point. Trade is to be exited once the blue line crosses the orange line from above.
At point B, we see the MACD line crosses the Signal line from top, that is when longs are to be exited. Also, observe how histogram turns red from green indicating shift in existing uptrend.
 3")
For short trades, entry to be made when the MACD line goes below zero line (this happens when 12 EMA > 26 EMA) and the Signal line till the MACD line crosses the Signal line from below.
- Divergences
 4")
The above chart shows price is making higher highs but MACD line is making lower highs forming a bearish divergence between two. This is followed by a bearish signal, at point A, when the MACD line crosses the signal line from above.
In such cases, early entry can be made even though the MACD line is above the zero line.
Key Takeaways
- MACD: A trend indicator using EMAs to show momentum and entry/exit points.
- MACD Line: Difference between 12 EMA and 26 EMA, oscillating around zero.
- Signal Line: 9 EMA of the MACD line for signal confirmation.
- Histogram: Difference between MACD and signal lines, showing momentum.
- Crossovers: Bullish when MACD crosses above signal; bearish when below.
- Divergences: Price-MACD divergence signals trend reversals.
![5-Minute Guide to Becoming 50% Pro Trader [Beginner]](https://thsinvestor.com/wp-content/uploads/2025/02/pro-trader-768x384.webp)