
Market Phases
While price charts may seem random at first glance, they actually follow a predictable pattern known as market phases — consisting of four key stages: accumulation, uptrend, distribution, and downtrend. Understanding these market phases helps traders identify where the market currently stands and what to expect next.

- Accumulation phase:
The market phases starts with accumulation. It is the phase when price stays in a tight zone, occurring after a significant fall in prices over a period of time.During this phase intelligent/big buyers buying while retailers selling after significant fall in prices. White/Green candles are formed with high volume while black/red ones with comparatively subdued volume
Volume is the number of shares/contracts traded during a given period. Suppose there are only 2 market participants in the market. A is buying 100 shares which are being sold by B (100 shares).Total volume will be 100 shares traded or exchanged hands.
- Uptrend:
This phase is marked by a significant increase in prices. When price breaks the tight consolidating zone, buying pressure increases as more people jump in to buy.
During uptrend/breakout, volume increases significantly which represents a large number of people who are willing to buy at any price available in the market which leads to increase in prices.
- Distribution:
Price starts to move in a small range with black/red candles having comparatively higher volume than white/green candles.Smart money is booking profits during this phase.
- Downtrend:
The final of market phases is Downtrend. During this phase, prices break down the distribution phase marked by increase in volume. Selling pressure is high, sellers are willing to sell at even lower prices which leads to fall in prices.
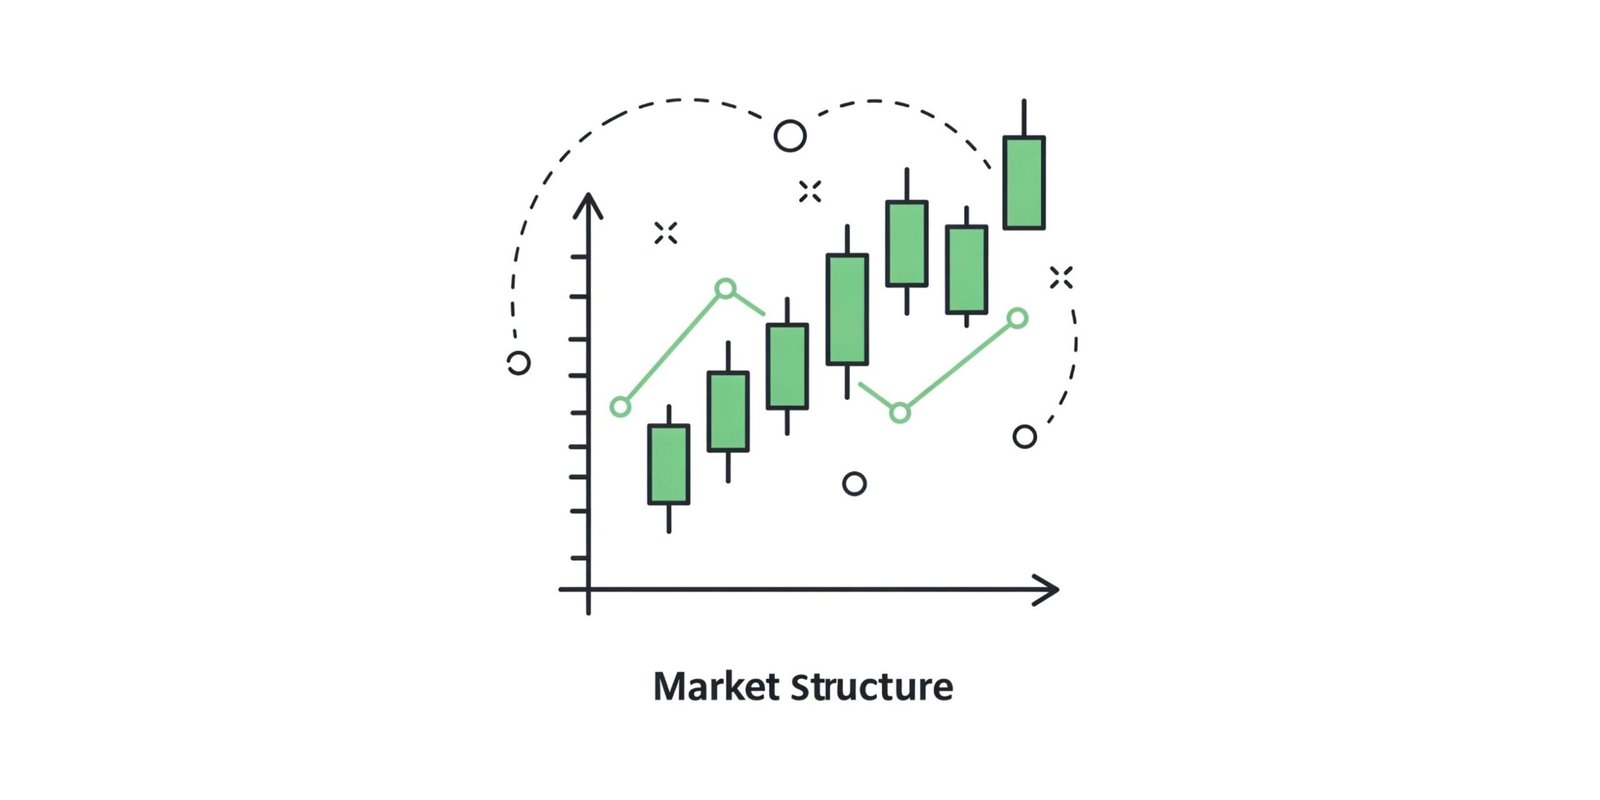
Structure of Market
There are 3 possibilities in the market – price can go up, down or stay in a range.
Prices form a structure while moving up or down. They never move in a straight line but rather follow a zigzag pattern.

Price in an uptrend makes a high and then comes down which is known as a pullback. This pullback is generally due to profit booking.
This pullback is marked by lower volume activity. Price then makes a higher high crossing the previous high and higher low. This trend is followed by price when it is going up.
A mirror reflection of this structure forms during a downtrend which is characterized by lower lows and lower highs.

Change in Market Structure
During uptrend, change of structure occurs when price fails to make higher highs and breaks previous higher low as shown above at point A. This shows the buying pressure is fading off.

Similarly, in downtrend, structure changes when price fails to make lower lows and breaks previous lower high, shown at point B.
This change in structure marks the end of the current trend and the start of an opposite trend.One must always align their trades with the existing trend. If the trend is up, look for buying opportunities/going long and if down, look for selling opportunities/going short.
How to use trends
Referring to the image below, the price is in downtrend making lower lows and lower highs. At point A, the structure is changing as price fails to form further LL and LH.

So logically, we should avoid any short trades. Price starts forming higher highs and higher lows. At one point, a support is created as shown. Now we have 2 strong points to take a buying trade – support and uptrend.
Always remember, the market and trades are a game of probability and nothing is certain. We must always try to find the confluence of multiple confirmations to increase probability of winning.
Additionally, one should focus on what if we are wrong? How much are we willing to lose? The answer to this is as little as possible.
In the above case, what happens if the price doesn’t go up and breaks the support instead? We exit as quickly as possible as one of our reasons to take the trade was support which should have prevented the price from falling.
This is how we keep our losses in control by exiting quickly when our original reasons to enter a trade fail.
Trend on larger timeframe
For instance, when trading on a 5-minute timeframe, analyze the larger timeframes (such as the hourly and daily charts) to understand the broader trend. Aligning your trades with the higher timeframe trend increases the probability of success and reduces the chances of being caught in a countertrend move.
Trading with the higher timeframe trend improves the likelihood of a strong follow-through in your direction.So, If the daily timeframe is in an uptrend, focus on taking long trades on the 5-minute timeframe, preferably near pullbacks to support.
Key takeaways
- Market Phases include – accumulation, uptrend, distribution, downtrend.
- There are 3 possibilities in the market – up, down, sideways.
- Uptrend is formed by higher highs and higher lows.
- Downtrend is formed by lower lows and lower highs.
- Confluence of confirmations increase probability of winning trade.
- Align trend of smaller time frame with that of larger time frame.