
This Indian Market Weekly Wrap covers the week of May 18 to 24, 2026.
Nifty 50 closed at 23,719, gaining just 0.32% for the week. The index swung more than 500 points during the week.
Nifty is forming an ascending triangle below the 23,800 resistance zone. Options data also supports this structure. The highest call open interest remains concentrated near 24,000.
FII activity also remained weak during the week. FIIs sold Rs 7,572 crore while DIIs bought Rs 16,947 crore, continuing to absorb institutional selling pressure.
The broader macro environment also remains difficult. Crude oil prices are still elevated, the rupee remains weak above 95 against the dollar, and uncertainty around US Iran tensions continues keeping global sentiment fragile.
Right now, the Indian stock market is not pricing a strong recovery. It is mainly pricing stability and containment near current levels.
Indian Market Weekly Wrap: Ascending Triangle Below 23800
The index fell sharply toward 23,317 early in the week as crude oil prices jumped and the rupee weakened above 96 against the dollar. But buyers continued defending lower levels and pushed the market back toward weekly highs by Friday.
From a Nifty technical analysis perspective, the index is now forming an ascending triangle on the daily chart. Higher lows continue forming near the 23,300 to 23,400 zone, showing buyers are gradually becoming more active on dips.
But the problem remains the same. Nifty still cannot break above 23,800.
This level matters because the 21 EMA on the daily chart sits near the same zone and continues acting as dynamic resistance. Every rally toward that area is facing selling pressure.
Options data also supports this structure. The highest call open interest remains concentrated near 24,000, showing option writers still expect the Indian stock market to stay below that level into expiry.
Right now, 23,800 remains the key breakout level for Nifty 50. A strong close above it with volume can improve short term sentiment and open the path toward 24,000 to 24,200.
On the downside, the 23,300 zone remains the key support. If that level breaks, the next major support comes near 23,000.
For now, the base case remains consolidation between 23,400 and 23,800 as the market continues trading inside a range ahead of expiry.
The important takeaway is that Nifty is slowly compressing into a breakout setup. Short term structure slightly favours the bulls because of higher lows, but the broader trend still remains weak until 23,800 is reclaimed decisively.
Indian Market Weekly Wrap: PSU Banks Drag, Private Banks Recover
Bank Nifty opened the week at 53,710 and closed at 54,055, gaining 0.64% during this Indian Market Weekly Wrap. The recovery mainly came from private banks, especially on Friday when the index gained 1.15%.
But the structure inside Bank Nifty remains divided. PSU banks and private banks are reacting very differently to the current macro environment.
PSU banks remained under pressure as rising crude oil prices, rupee weakness, and elevated bond yields continued increasing concerns around margins and credit quality. SBI, Canara Bank, and PNB all saw selling pressure during the week.
On the other hand, private banks like ICICI Bank, Kotak Bank, and Axis Bank showed relative strength. The private banking index gained 1.49% on Friday, showing institutions are rotating toward quality financial stocks instead of exiting the sector completely.
From a Bank Nifty analysis perspective, options data still remains cautious. PCR closed near 0.74, which shows option writers are still not confident about sustained upside.
The 54,000 zone remains the key level right now as max pain also sits near the same area. That makes 54,000 an important expiry magnet going into the May 26 expiry.
Resistance now shifts toward 55,000 where the highest call open interest is concentrated, while 54,000 remains immediate support from put writers.
The key level to watch is 54,500. Bank Nifty needs a strong close above that zone to improve the short term structure.
The important takeaway from this Indian Market Weekly Wrap is that Bank Nifty is no longer moving as one sector. Private banks continue showing relative strength while PSU banks remain the weak link under current macro conditions.
Indian Market Weekly Wrap: IT Leads, Media Collapses
As per NSE India, IT was the strongest sector during this Indian Market Weekly Wrap, gaining 4.31% while the broader Indian stock market struggled to move higher.
The main reason was the rupee. IT companies earn largely in dollars but report earnings in rupees, so rupee weakness directly improves revenue translation. In the current environment of elevated crude and a weak rupee, IT becomes a natural defensive sector inside Nifty 50.
Institutional positioning also supported the move. Infosys gained 4.51% during the week, Tech Mahindra rose 4.85%, and HCL Technologies added 2.91% as money rotated toward large cap IT names.
This does not look like a full fundamental turnaround for the IT sector yet. It looks more like institutions moving toward defensive sectors that benefit from the same macro pressures hurting the broader market.
Realty gained 2.39% as some traders positioned the sector as an inflation and liquidity hedge.
Defence stocks also stayed strong with gains of 1.10% as geopolitical tensions continued supporting the long term defence spending narrative.
Energy and Oil and Gas sectors gained around 1% as elevated crude prices continued supporting the space.
On the weaker side, Media fell 4.29%, reflecting concerns around slowing consumer spending and weaker advertising demand.
Auto remained mostly flat with a 0.21% decline. The sector continues balancing higher input costs against relatively stable premium demand.
What matters next is whether the current defensive rotation continues. If crude cools and the rupee stabilises, IT could lose some relative strength while private banks may start attracting stronger institutional flows again.
Indian Market Weekly Wrap: DIIs Absorb the Storm
FII selling continued dominating this Indian Market Weekly Wrap as foreign investors sold a net Rs 7,572 crore during the week. DIIs absorbed the pressure with Rs 16,947 crore of buying, which helped Nifty avoid a deeper breakdown.
The important pattern was how FIIs behaved around market moves. The only buying session came near the sharp decline toward 23,317, where panic selling created short term value buying opportunities. But every recovery after that saw renewed institutional selling pressure.
This shows FIIs are still treating rallies as exit opportunities rather than positioning for a sustained recovery in the Indian stock market.
The broader macro setup explains the behaviour. Total FPI outflows from Indian equities in 2026 have already crossed Rs 2.19 lakh crore while foreign ownership has dropped to decade lows near 15%.
Higher US bond yields and a strong dollar continue attracting global capital toward safer developed market assets instead of emerging markets like India.
For India, the biggest pressure point remains the crude oil and rupee cycle. Elevated crude widens the current account deficit, increases dollar demand, weakens the rupee, and ultimately reduces FII returns when converted back into dollars. That cycle keeps institutional selling pressure active.
DII buying remains the biggest support for the Indian stock market right now. Domestic institutions are consistently absorbing supply, but most of the buying is defensive rather than aggressive trend creating capital.
What matters next is crude oil. If oil prices cool toward $100, FII selling pressure may slow and allow Nifty to attempt a breakout above resistance. But another spike in crude could quickly restart aggressive institutional selling again.
How Many Stocks Were Actually Going Up
Indian Market Weekly Wrap: Option Writers Are Positioned Defensively
The F&O setup entering the May 26 expiry still points toward a range bound market rather than a breakout.
Nifty PCR closed near 1.02, which looks balanced on the surface. But during the week, PCR repeatedly dropped whenever Nifty approached higher levels, showing option writers were aggressively adding calls near resistance.
Max pain for Nifty sits at 23,800 while the index closed near 23,719. That close alignment suggests expiry gravity may continue keeping Nifty inside the 23,600 to 23,800 range.
The biggest resistance remains the 24,000 strike where the highest call open interest is concentrated with more than 1.29 crore contracts. This remains the main call wall for the market.
On the downside, the 23,500 strike holds the highest put open interest. Put writers are actively defending that zone, making it the key support level for Nifty 50 going into expiry week.
India VIX also cooled toward 16.70 after spiking above 19 earlier in the week. Lower VIX shows panic selling has reduced, but the market is still not in a fully comfortable risk on environment yet.
For Bank Nifty analysis, PCR remained weak near 0.74, showing call writers still dominate positioning. Max pain sits at 54,000, almost exactly where Bank Nifty closed the week.
The key thing to watch now is whether the 24,000 call wall starts unwinding. If call writers begin covering positions, Nifty can move toward 24,000 quickly. But that move likely still needs a macro trigger such as cooling crude oil prices or slowing FII selling.
Indian Market Weekly Wrap: IPO Tracker
| Company | M.Cap (Cr) | P/E | ROCE | Subscription |
|---|---|---|---|---|
| Q-Line Biotech | ₹214 | N/A | N/A | 9.2xx |
| Bio Medica Lab | ₹52 | N/A | N/A | 1.0xx |
| M R Maniveni | ₹102 | 26.2 | 21 | 1.0xx |
| Autofurnish | ₹15 | 15.7 | 34 | 0.5xx |
| Yaashvi Jewellers | ₹44 | 13.0 | 40 | N/Ax |
| SMR Jewels | ₹67 | 24.2 | 67 | N/Ax |
| Rajnandini Fashion | ₹18 | 12.9 | 54 | N/Ax |
| Merritronix | ₹70 | N/A | N/A | N/Ax |
Key Events to Watch Next Week
| Event | Date | Forecast | Previous |
|---|---|---|---|
| Manufacturing Production YoY | 1 Jun 16:00 | N/A | 4.3 |
| Industrial Production YoY | 1 Jun 16:00 | N/A | 4.1 |
| RBI Interest Rate Decision | 5 Jun 10:00 | 5.25 | 5.25 |
| GDP Growth Rate YoY | 5 Jun 16:00 | 6.9 | 7.8 |
| Inflation Rate YoY | 12 Jun 16:00 | N/A | 3.48 |
| Balance of Trade | 16 Jun 14:30 | N/A | -28.40 |
Indian Market Weekly Wrap: Crude, Rupee, and Iran Talks Drive the Week
US-Iran Diplomacy Shows Marginal Progress
US Secretary of State Marco Rubio indicated some forward movement in talks by Friday, which sent crude oil off its highs and global equities higher including the Dow to record closing levels. However, structural differences remain and the Strait of Hormuz supply risk has not been resolved. Pakistan's military chief visited Tehran as a mediator. Markets reacted positively to the tone shift, with crude pulling back and Indian IT and banking stocks recovering sharply into Friday's close.
Rupee Hits Record Low Above 96 - Multiple Sessions Through the Week
The Indian rupee touched a record intraday low of 95.74 to 96.96 across multiple sessions through the week, its worst levels ever against the dollar. The rupee's weakness has a compounding effect on India: it expands the import bill for crude, widens the current account deficit, reduces FII dollar returns, and triggers further outflows. The RBI has been intervening through PSU banks but has limited ammunition given the CAD widening simultaneously. FPI outflows in 2026 have now crossed Rs 2.19 lakh crore, which is directly connected to rupee weakness.
FPIs Pull Over Rs 27000 Crore in May So Far, 2026 Total Crosses Rs 2.2 Lakh Crore
Foreign portfolio investors have pulled over Rs 27000 crore from Indian equities in May alone, taking the 2026 total past Rs 2.19 lakh crore. FPI ownership of Indian equities has fallen to 15%, the lowest in a decade. Capital is moving to US Treasuries and AI-driven global equities, where return profiles look more attractive. This structural outflow trend is the dominant pressure on the rupee and the key reason Nifty cannot sustain breakouts above key moving averages despite reasonable domestic macro fundamentals.
Indian Market Weekly Wrap: Technical View
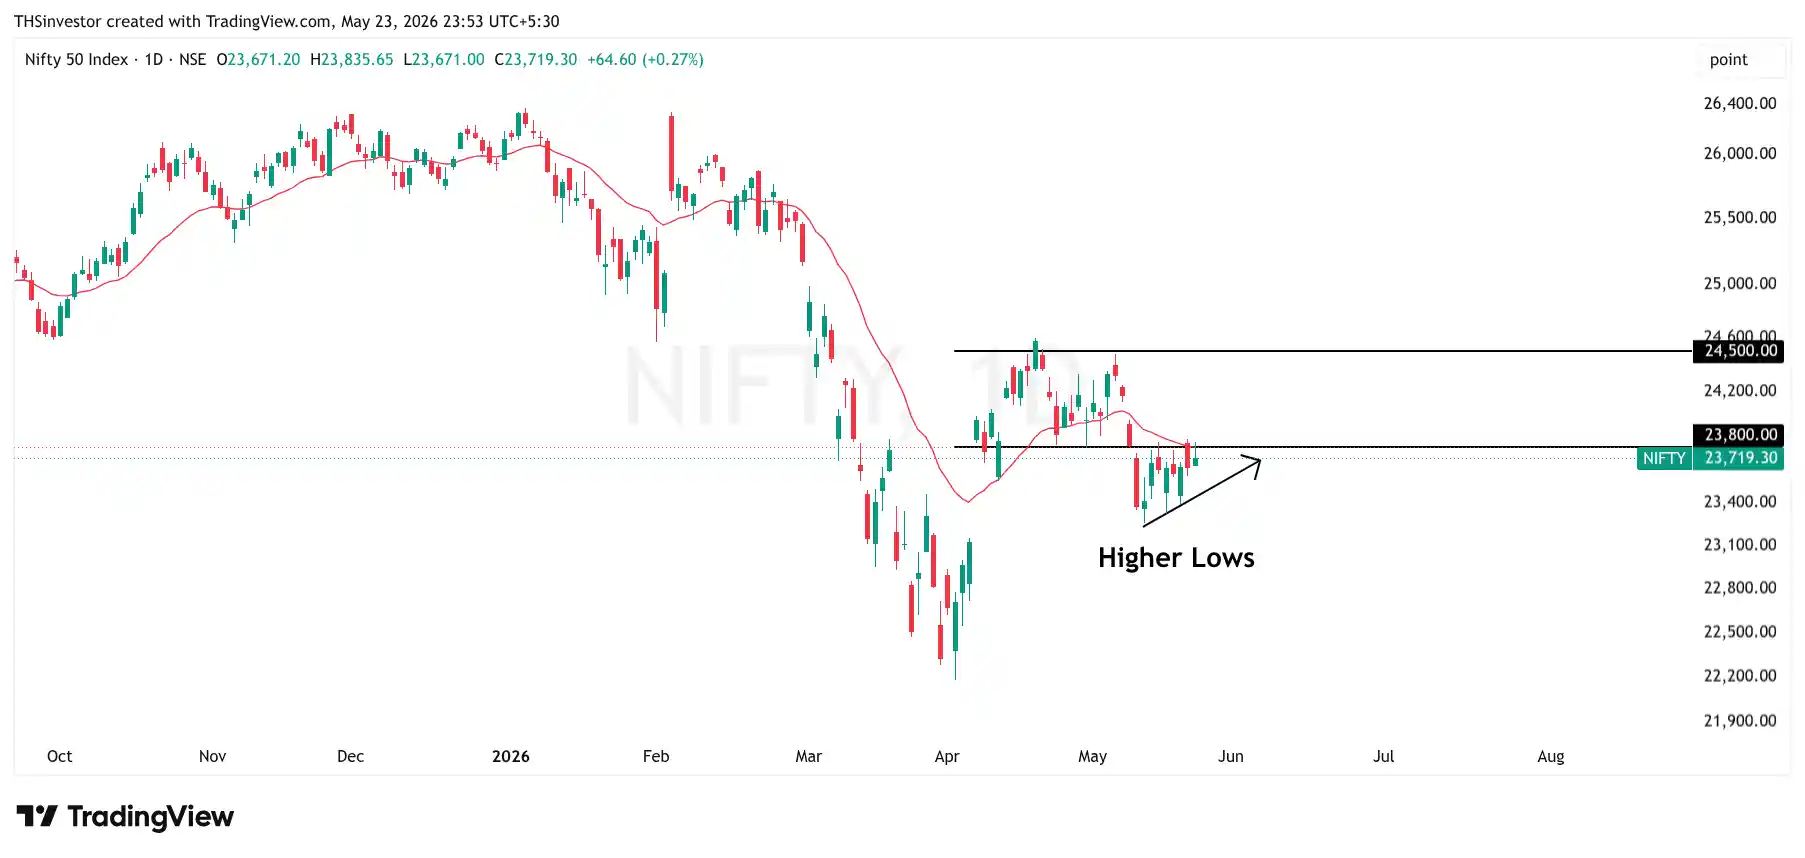
Nifty 50 is forming an ascending triangle on the daily chart as higher lows continue forming from the 23,300 support area while rallies keep getting rejected near 23,800. That compression usually signals a larger move is approaching.
The most important level right now is 23,800.
The 21 EMA on the daily timeframe sits near the same zone and continues acting as dynamic resistance. Nifty has tested that level multiple times but still failed to close above it with strength. A confirmed daily or weekly close above 23,800 would improve the short term structure significantly and open the path toward 24,000 to 24,200.
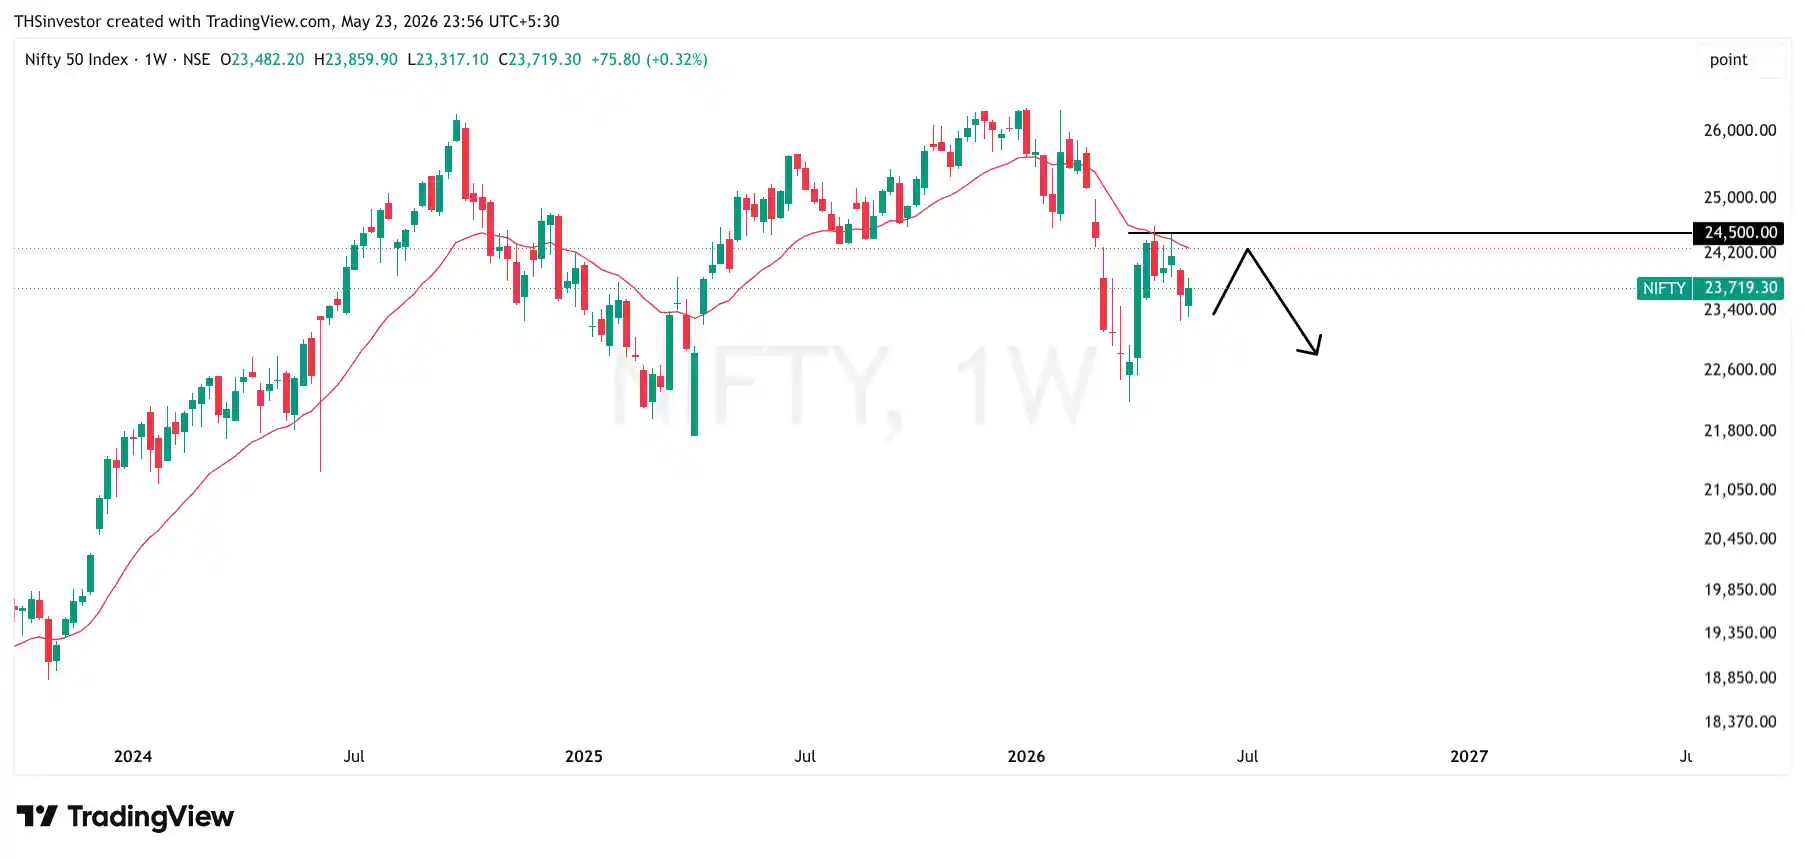
On the weekly chart, the 21 EMA sits much higher near 24,500, and Nifty continues trading well below it. That means the broader trend has not reversed yet even though daily price action is improving.
The key support levels remain 23,500 and 23,300. Put writers continue defending 23,500 into expiry, while 23,300 remains the major structural floor for the current setup.
A weekly close below 23,300 would invalidate the ascending triangle and shift market bias sharply lower.
For now, the best approach remains patience. Traders can continue working the 23,300 to 23,800 range while waiting for a confirmed breakout.
Long term investors should avoid aggressive fresh positions until Nifty reclaims 24,500 and confirms a broader trend change in the Indian stock market.
Indian Market Weekly Wrap: Ascending Triangle, 23800 Resistance, and the Long-Term Bear Case
The Indian stock market remains slightly bullish on the short term timeframe but structurally bearish on the long term chart. Both conditions are active at the same time.
From a Nifty technical analysis perspective, the short term structure is constructive. Nifty continues forming higher lows after defending the 23,300 zone, creating an ascending triangle pattern on the daily chart.
The longer term structure still remains weak. On the weekly chart, the 21 EMA sits near 24,500, which remains the key level needed for a broader trend reversal in the Indian stock market.
For Nifty 50 to reclaim 24,500, macro conditions also need to improve meaningfully. Crude oil prices need to cool, the rupee needs to stabilise, and FII selling needs to slow or reverse.
The next major trigger for markets is the June 5 RBI meeting, which could influence liquidity expectations and overall market sentiment.
The bullish case remains a breakout above 23,800 leading toward 24,000 to 24,200.
The bearish case remains tied to higher crude prices, rupee weakness beyond 97, and continued FII selling. If Nifty loses 23,300, the next major support comes near 23,000.
For now, the base case remains range bound consolidation between 23,400 and 23,800 while markets wait for a stronger macro catalyst.

![Top Nifty 50 Companies [2025]](https://thsinvestor.com/wp-content/uploads/2025/04/top-5-nifty-50-companies-768x384.webp)