

This Crypto Weekly Wrap was one of the clearest macro driven weeks of 2026.
Bitcoin opened at $82,200 and closed near $77,432, falling roughly 5.68%. The selling was mainly driven by rising Treasury yields and tightening liquidity, not crypto specific fear.
The US 10 year Treasury yield climbed to 4.6% while the 30 year moved above 5.1%, pushing institutional money away from risk assets like crypto.
Spot Bitcoin ETFs saw more than $1 billion in outflows, ending a six week inflow streak that had brought in $3.4 billion. That confirmed institutions were reducing exposure instead of defending positions.
The Clarity Act did give markets a temporary bounce after passing the Senate Banking Committee in a 15 to 9 vote, but Bitcoin’s recovery toward $81,958 was quickly sold into.
That reaction showed the market is trading macro first and regulation second right now.
From a Bitcoin technical analysis perspective, BTC also broke below the 21 EMA and lost the key $79,000 support zone.
Until Bitcoin reclaims the $79,000 to $80,000 range, long positions continue carrying elevated risk. Altcoins also underperformed as the crypto market remained firmly risk off throughout the week.
Crypto Weekly Wrap: Bitcoin Loses Key Structure as Yields Override Everything
Bitcoin opened this Crypto Weekly Wrap at $82,201 and failed to hold the $79,000 to $80,000 zone.
The selling was mainly macro driven. US PPI came in at 6% while CPI data confirmed inflation pressure remains strong. Markets quickly reduced Fed rate cut expectations and Treasury yields surged higher.
The US 10 year yield climbed near 4.6% while the 30 year moved above 5.1%, pushing institutional money away from risk assets like crypto.
That pressure became visible through more than $1 billion in Bitcoin ETF outflows during the week.
The Clarity Act passing the Senate Banking Committee briefly pushed Bitcoin toward $81,958, but the rally was quickly sold into. The market is still trading macro first and regulation second.
From a Bitcoin technical analysis perspective, BTC remains weak and closely tied to broader risk asset performance.
The key support zone now sits between $77,000 and $77,500. If that breaks, the next major support comes near $75,000.
Crypto Weekly Wrap: ETH Underperforms and Loses Ground Below $2,130
Ethereum fell from $2,371 to $2,130 during this Crypto Weekly Wrap, losing roughly 10.15% and underperforming Bitcoin.
That is a clear risk off signal. ETH dominance also dropped from 10.05% to 9.66%, showing capital was leaving Ethereum instead of rotating into altcoins.
Despite weak price action, the long term institutional story around Ethereum kept improving. JPMorgan Chase filed a tokenised money market fund on Ethereum, while BlackRock and Fidelity Investments received top ratings for tokenised products.
The Clarity Act could also become a major long term catalyst for Ethereum by improving institutional adoption and ETF expansion.
From an Ethereum technical analysis perspective, ETH needs to reclaim the $2,250 to $2,300 zone before bullish momentum can return.
If macro pressure continues, Ethereum could break below $2,100 and move toward the next major support near $2,000.
Crypto Weekly Wrap Market Forces: Rising Yields Are the Real Driver, Not Crypto News
The macro setup during this Crypto Weekly Wrap remained bearish for risk assets.
Hotter than expected CPI and PPI data pushed markets to fully price out Fed rate cuts for 2026 while increasing expectations for another rate hike before year end.
That triggered a bond selloff. The US 30 year Treasury yield moved above 5.1% while the 10 year stayed near 4.6%, tightening liquidity and pressuring crypto markets.
This is why Bitcoin traded like a risk asset instead of a macro hedge during the week. Once liquidity weakened and ETF flows turned negative, prices followed lower quickly.
The Clarity Act briefly supported markets after passing the Senate Banking Committee, but the rally faded as traders shifted focus back toward macro conditions.
Institutional activity still remained active. Strategy bought another 535 BTC while MARA Holdings sold $1.5 billion in Bitcoin to reduce debt and expand AI infrastructure.
The key things to watch now are Treasury yields, ETF flows, and whether institutional buyers continue accumulating during the correction.
Crypto Weekly Wrap ETF Flows: Six-Week Inflow Streak Ends With $1B Weekly Bleed
Spot Bitcoin ETFs recorded more than $1 billion in net outflows during this Crypto Weekly Wrap, ending a six week inflow streak that had previously brought in $3.4 billion.
This was one of the clearest signs that institutions reduced exposure as macro conditions worsened and Treasury yields moved sharply higher.
The important detail was market behaviour around the Clarity Act. Bitcoin briefly bounced after the bill passed the Senate Banking Committee, but ETF inflows did not return. That showed the rally was driven mainly by short covering rather than fresh institutional buying.
At the same time, ETF assets under management still remained near $104 billion, which means institutions are not exiting crypto completely. This looks more like risk management during a macro shock rather than a structural breakdown in institutional interest.
What matters next is whether ETF flows turn positive again. A recovery in inflows would signal that institutions are absorbing the macro pressure and rebuilding exposure.
But if outflows continue, Bitcoin could face further downside pressure with the $75,000 zone becoming the next major support area.
Crypto Weekly Wrap Sector Rotation: No Safe Zone This Week Except Selective DEX Strength
Sector performance during this Crypto Weekly Wrap showed broad weakness across the market.
Layer 2 tokens led losses at 14.6%, followed by DePIN at 13.4%, AI tokens at 12.3%, and infrastructure at 11.6%. Gaming, Layer 1, and DeFi sectors also saw heavy declines.
This was not sector rotation. The market was reducing overall exposure as liquidity conditions tightened.
Even exchange related tokens fell 4.6%, showing weakness spread across nearly every category.
DEXs and prediction markets showed relative strength, but mainly due to defensive hedging activity rather than bullish buying.
AI tokens remained under pressure despite growing institutional interest around AI infrastructure and tokenisation. Markets are currently reacting more to liquidity risk than long term narratives.
Meme coins also weakened sharply as speculative capital continued leaving the market.
What matters next is whether DeFi and Layer 1 sectors can recover strength. Until then, crypto markets will continue trading macro liquidity conditions more than project fundamentals.
Crypto Weekly Wrap Market Breadth: One Session of Strength in a Week of Institutional Retreat
Market breadth during this Crypto Weekly Wrap clearly showed institutions reducing risk exposure.
The strongest breadth came after the Clarity Act passed the Senate Banking Committee, with 27 advancing sectors against just 3 declining. That confirmed the news triggered broad buying across crypto.
But the recovery lasted only one session.
The very next day, breadth collapsed again with only 1 advancing sector out of 30. The market quickly gave back the entire relief rally. Market data from CoinMarketCap confirms this.
This is important because strong bull markets usually show improving breadth across multiple sessions. A one day spike followed by immediate weakness usually signals a short term relief rally rather than a real trend reversal.
The broader picture still remains defensive. Until Treasury yields stabilise and ETF flows turn positive again, market breadth will likely remain weak across the crypto market.
Key Events Shaping This Crypto Weekly Wrap
CLARITY Act Clears Senate Banking Committee 15-9
The Digital Asset Market CLARITY Act passed the Senate Banking Committee on May 14 in a bipartisan 15-9 vote, advancing to the full Senate floor. The bill formally divides oversight between the SEC and CFTC and converts Bitcoin's commodity classification into federal statute. Bitcoin spiked to $81,958 on the news before retracing fully within 48 hours. The bill now requires 60 Senate floor votes and must be reconciled with the House version. Citi analysts have tied a $143,000 BTC target to full CLARITY Act passage, citing a potential additional $15 billion in net ETF inflows. The August window for a Senate floor vote is the next critical date. This is the most structurally important regulatory development for the crypto market in years. The short-term price reaction was faded. The long-term implications remain intact.
Spot Bitcoin ETFs Record $1 Billion in Weekly Outflows, Ending Six-Week Inflow Run
Spot Bitcoin ETFs shed over $1 billion from May 11 to May 15, ending a six-week streak that had accumulated $3.4 billion. The week's largest single-day outflow was $635 million on Wednesday, the biggest since January. BlackRock's IBIT led outflows on the week's negative days. No dominant buyer emerged to replace the institutional bid. Cumulative ETF AUM sat near $104 billion at week's close. The outflow pattern was macro-driven, triggered by hot CPI and PPI prints pushing yields to multi-year highs. Capital rotated toward AI stocks and out of crypto. This flow reversal is a critical warning signal and the primary reason BTC lost structural support at $79,000 to $80,000 this week.
JPMorgan Files Tokenised Money Market Fund on Ethereum, Institutional Tokenisation Accelerates
JPMorgan filed a prospectus for the OnChain Liquidity-Token Money Market Fund on the Ethereum network, ticker JLTXX, investing exclusively in US Treasury securities and overnight repo. Moody's assigned Aaa-mf ratings to both BlackRock and Fidelity International tokenised money market funds. Fidelity International launched a separate tokenised fund using Chainlink and Sygnum infrastructure. Societe Generale also moved its EUR and USD CoinVertible stablecoins toward the Canton Network for institutional repo and settlement use. This institutional tokenisation buildout is a structural long-term Ethereum catalyst. Wall Street is building the infrastructure for on-chain institutional finance. The price action this week did not reflect this. Macro overrode fundamentals. The implication is that when macro stabilises, Ethereum will price this buildout.
Bitcoin Technical Analysis: Structure Broken, Sell on Rise Until $79,000 to $80,000 Reclaimed
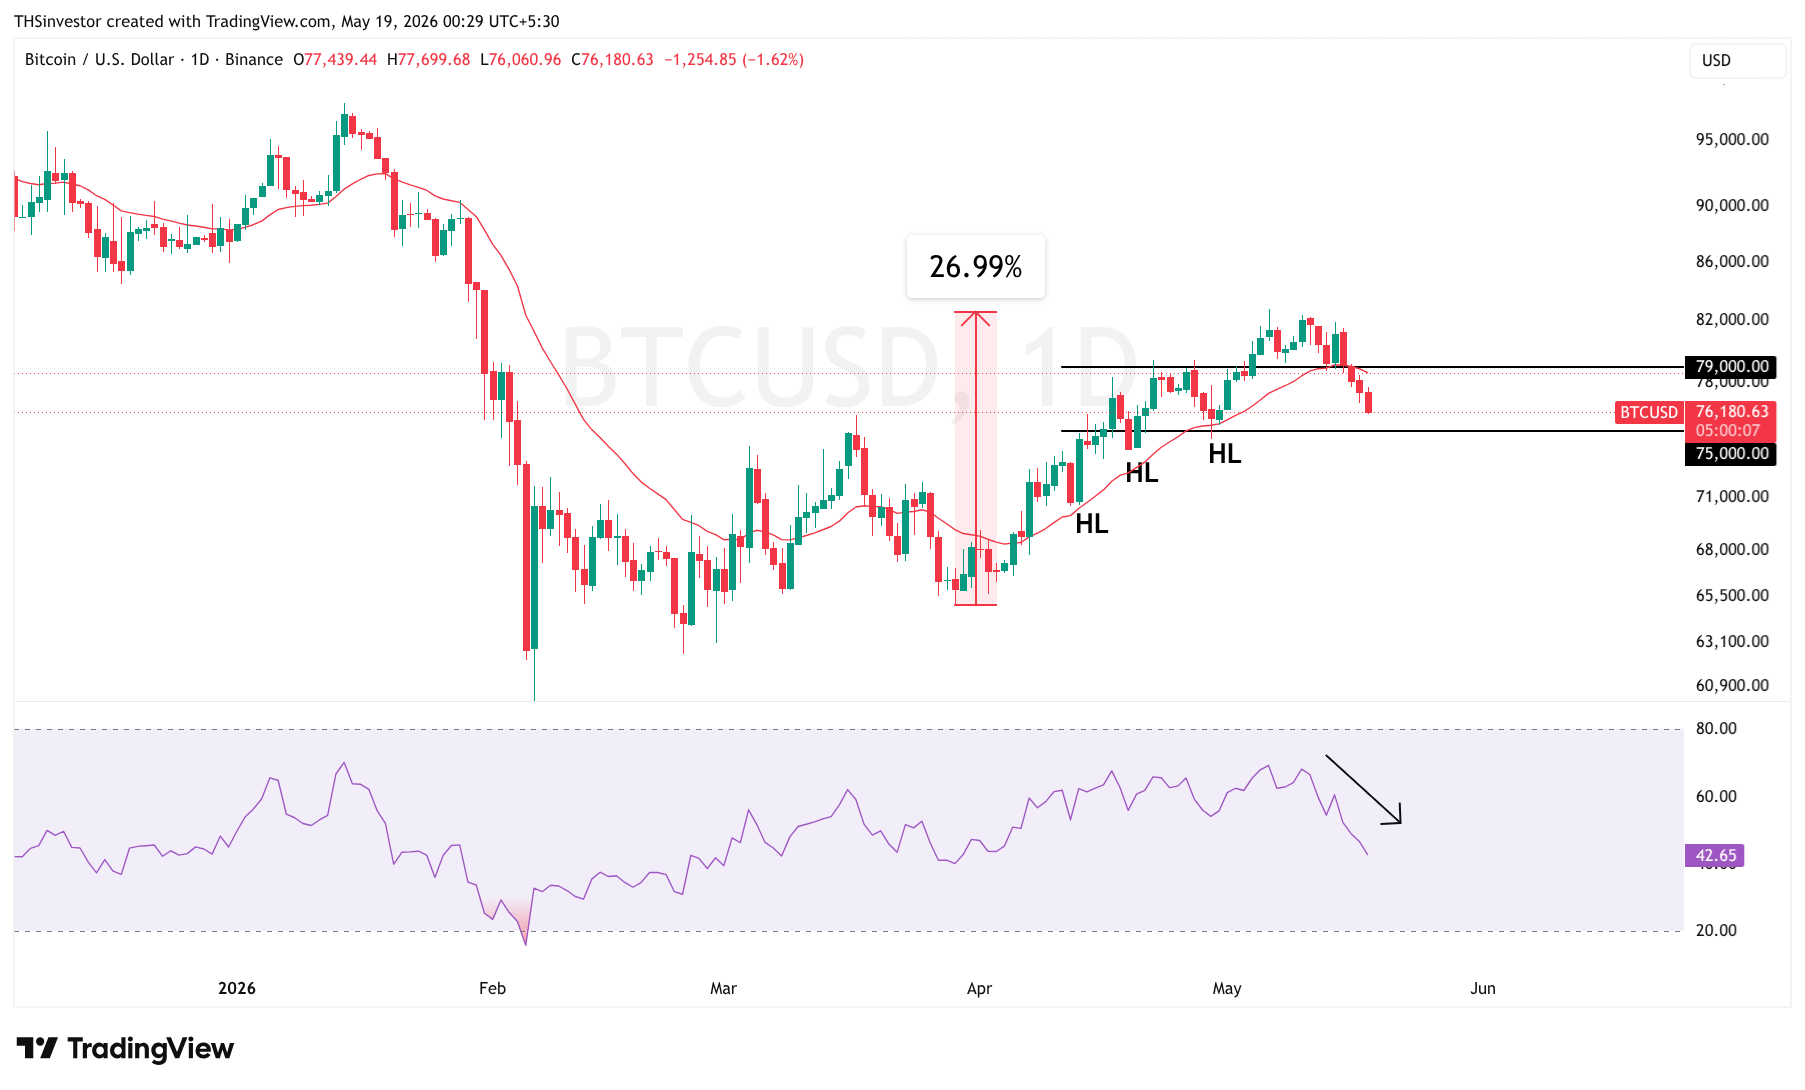
After the March lows, Bitcoin rallied nearly 27% toward the $83,000 zone while consistently holding the 21 EMA and forming higher highs and higher lows. That structure is now breaking down.
The biggest technical change this week was the loss of the 21 EMA along with the important $79,000 support zone. BTC had defended that level multiple times throughout April and early May, but this week price closed below it and failed to reclaim it.
That matters because a break below the 21 EMA after a strong uptrend is usually a structural warning, not normal volatility.
RSI is also confirming weakness. The indicator continues forming lower highs and lower lows along with price, while no bullish divergence is visible yet. Momentum is still trending downward rather than stabilising.
Another important point is Bitcoin’s growing correlation with US equities. BTC is currently trading like a risk asset instead of an independent macro hedge, which means rising Treasury yields continue pressuring crypto prices.
The next major support now sits near $75,000. That level is critical for maintaining the broader recovery structure from the March lows. If Bitcoin loses $75,000, the next major support area comes near $70,000 to $72,000.
On the upside, the $79,000 to $80,000 zone has now turned into resistance. What was previously support is now likely to act as a supply zone where sellers become active again.
For now, the trading bias remains sell on rise instead of aggressive long positioning. Bitcoin needs to reclaim and sustain above the $79,000 to $80,000 zone with strong volume before the short term structure can improve again.
Crypto Weekly Wrap Outlook: Sell on Rise Until $79,000 to $80,000 Is Reclaimed
The crypto market structure entering next week remains bearish until proven otherwise.
From a Bitcoin technical analysis perspective, BTC has broken below the 21 EMA and lost the important $79,000 support zone that had held since the March recovery. RSI also continues forming lower highs and lower lows, confirming weak momentum.
The bigger issue remains macro conditions. Treasury yields are still near multi year highs with the US 30 year yield above 5.1%. Markets are also pricing the possibility of another Fed rate hike while elevated oil prices continue keeping inflation pressure high.
Right now, Bitcoin is trading more like a risk asset than an uncorrelated hedge. BTC continues moving closely with US equities and broader liquidity conditions.
The Clarity Act remains the biggest potential bullish catalyst for crypto, but the full approval process will still take time even after the Senate Banking Committee pass.
The base case for this Crypto Weekly Wrap is consolidation between $75,000 and $80,000 while markets wait for macro conditions to stabilise.
The bullish scenario depends on falling Treasury yields, improving ETF inflows, and Bitcoin reclaiming the $80,000 zone. In that case, BTC could move back toward $84,000 to $87,000.
The bearish scenario remains tied to rising yields and continued ETF outflows. If Bitcoin loses $75,000, the next major support zone sits near $70,000 to $72,000.
For now, the market still remains sell on rise rather than aggressive dip buying. Bitcoin needs to reclaim and hold the $79,000 to $80,000 zone before the short term structure can improve again.


![Bitcoin Analysis [March 2025]: Charts, Trends & Predictions](https://thsinvestor.com/wp-content/uploads/2025/02/Bitcoin-march-768x403.webp)