
What is a head and shoulders pattern?
A head and shoulders pattern is a reliable reversal pattern which marks the end of an existing uptrend. An inverted head and shoulders pattern appears at the end of downtrend.

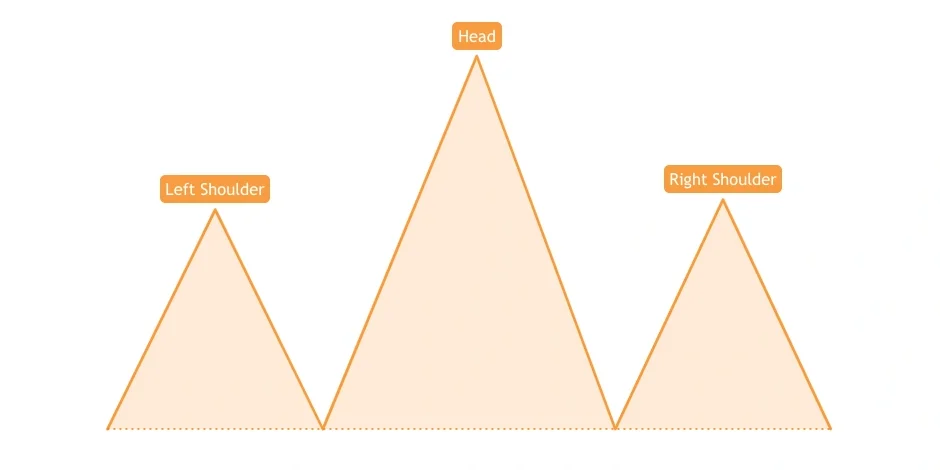
The pattern has 3 peaks, left shoulder, head and right shoulder. These 3 peaks overlap at a price forming a support zone which is termed as a Neckline.
This Neckline need not be perfectly horizontal, it can be slightly up or down sloping.
Structure of Head and Shoulders pattern
The following are the structural aspects of the Head and Shoulders pattern:

- Head should not be more than 2x to 3x the size of the shoulders.
- The shoulders should be of similar heights, though slight variations can be there. Right shoulder should be equal to or smaller than the left shoulder. If the right shoulder crosses the high of the left shoulder, it signals high buying pressure.
- Neckline need not be exactly horizontal. But horizontal is more reliable as the exact level of support is being tested repeatedly.
- Volume gradually decreases from left shoulder to right shoulder during upward movement.
- Breakout of the neckline with high volume validates the pattern.
- A clean right shoulder is preferred. In the above example, the right shoulder has a bit more of consolidation which shows the presence of buyers. A clean breakout means sellers are in complete control.
Psychology behind Head and Shoulders pattern
One need not look for exact patterns, rather understand the psychology or fight between buyers and sellers. Below are some points which reflect the same:

- Prior to the formation of the left shoulder, price is in uptrend and formation of the low of left shoulder looks like a higher low of existing trend. Volumes are more than average till this point.
- Prince then breaks the high of the left shoulder which looks like a continuation of the uptrend but sellers manage to bring the price back to the neckline. At this point, price fails to make a higher low. Volumes of uptrend are suppressed. This is seen as a failed rally and attracts sellers.
- During the formation of the left shoulder, prices are unable to cross the high of the head and make a lower high which are all the signs of weakness.
Trading Head and Shoulders pattern
To trade this pattern successfully, consider the following entry, exit, and stop-loss points.

Entry:
Traders should look to enter only after breakout of the neckline with volume confirmation. Some traders wait for a retest of the neckline after the breakout. Sometimes, prices do not retest the neckline if momentum of breakdown is on the higher side.
Target:
Roughly, the target is seen as many points down as up from neckline to the high of head. We can use many other ways discussed earlier to book our profits.
Stop Loss:
Again, there is no fixed SL, some traders place it above the breakout candle while some may keep it a bit far away from the neckline according to volatility of prices.
Nevertheless, the neckline or high of the right shoulder, if it is not too far away, can be used for reference according to risk tolerance and position sizing of the trader. Intraday traders may place smaller SL than positional traders.
Inverted Head and Shoulders pattern
The inverted head and Shoulders pattern is a bullish reversal pattern which is formed at the end of the downtrend. All the points covered above are applicable here also.

Key Takeaways
- H&S pattern is a reliable reversal pattern, formed at top in the uptrend and at bottom in downtrend.
- It consists of 3 peaks, left shoulder, a head and right shoulder. High shoulders should be comparable and a head should be higher than shoulders.
- Entry to be made only after breakout of neckline with volume.
- SL can be placed at top of the breakout candle.